Difference between revisions of "S-MALL Application"
Jump to navigation
Jump to search
| (32 intermediate revisions by 3 users not shown) | |||
| Line 5: | Line 5: | ||
</div> | </div> | ||
{|style="background-color:#565656;" width="100%" cellspacing="0" cellpadding="0" valign="top" border="0" | | {|style="background-color:#565656;" width="100%" cellspacing="0" cellpadding="0" valign="top" border="0" | | ||
| − | | style="font-family:Century Gothic; font-size:100%; solid #000000; background:#565656; text-align:center;" width=" | + | | style="font-family:Century Gothic; font-size:100%; solid #000000; background:#565656; text-align:center;" width="25%" | |
; | ; | ||
[[S-MALL_Overview| <font color="#FFFFF">Overview</font>]] | [[S-MALL_Overview| <font color="#FFFFF">Overview</font>]] | ||
| − | | style="font-family:Century Gothic; font-size:100%; solid #1B338F; background:# | + | | style="font-family:Century Gothic; font-size:100%; solid #1B338F; background:#2e5b84; text-align:center;" width="25%" | |
; | ; | ||
| − | [[S- | + | [[S-MALL_Application| <font color="#FFFFFF">Application</font>]] |
| − | | style="font-family:Century Gothic; font-size:100%; solid #1B338F; background:# | + | | style="font-family:Century Gothic; font-size:100%; solid #1B338F; background:#565656; text-align:center;" width="25%" | |
; | ; | ||
| − | [[S- | + | [[S-MALL_User Guide| <font color="#FFFFFF">User Guide</font>]] |
| − | | style="font-family:Century Gothic; font-size:100%; solid #1B338F; background:#565656; text-align:center;" width=" | + | | style="font-family:Century Gothic; font-size:100%; solid #1B338F; background:#565656; text-align:center;" width="25%" | |
; | ; | ||
[[S-MALL_Poster| <font color="#FFFFFF">Poster</font>]] | [[S-MALL_Poster| <font color="#FFFFFF">Poster</font>]] | ||
| − | |||
| − | |||
| − | |||
| − | |||
| | | | ||
| Line 31: | Line 27: | ||
<table width=100%> | <table width=100%> | ||
<tr> | <tr> | ||
| − | <td align="center"><font size = 2><span style="font-family:Century Gothic;"><b>Movement Analysis</b></span></font></td> | + | <td align="center"><font size = 2><span style="font-family:Century Gothic;"><b>[https://smartcafe.shinyapps.io/s-mall1-movement_analysis/ Movement Analysis]</b></span></font></td> |
| − | <td align="center"><font size = 2><span style="font-family:Century Gothic;"><b>[https:// | + | <td align="center"><font size = 2><span style="font-family:Century Gothic;"><b>[https://smartcafe.shinyapps.io/s-mall2-members_analysis/ Member Analysis]</b></span></font></td> |
| − | <td align="center"><font size = 2><span style="font-family:Century Gothic;"><b>[https:// | + | <td align="center"><font size = 2><span style="font-family:Century Gothic;"><b>[https://smartcafe.shinyapps.io/s-mall3-association_rules/ Association Analysis]</b></span></font></td> |
</tr> | </tr> | ||
</table> | </table> | ||
| Line 49: | Line 45: | ||
! scope="col" style="width: 40%; font-family:Century Gothic;"| Usage | ! scope="col" style="width: 40%; font-family:Century Gothic;"| Usage | ||
|- | |- | ||
| − | ! scope="row" style="background: #ffffff;"| | + | ! scope="row" style="background: #ffffff;"| |
| + | [[File:T3 Trellis.JPG|center|300px]] | ||
| | | | ||
<ul> | <ul> | ||
| Line 67: | Line 64: | ||
<ul> | <ul> | ||
<li>Chart type: Chord diagram</li> | <li>Chart type: Chord diagram</li> | ||
| − | <li>R Package: chorddiag</li> | + | <li>R Package: [https://github.com/mattflor/chorddiag chorddiag]</li> |
<li>Interactivity: Set specific datetime using selectIput and sliderInput to view the traffic transfer across floors.<br> | <li>Interactivity: Set specific datetime using selectIput and sliderInput to view the traffic transfer across floors.<br> | ||
Hover to each floor to see the destination of its outflow traffics.</li> | Hover to each floor to see the destination of its outflow traffics.</li> | ||
| Line 81: | Line 78: | ||
<ul> | <ul> | ||
<li>Chart type: Hexagonal binning map</li> | <li>Chart type: Hexagonal binning map</li> | ||
| − | <li>R Package: hexbin, [https://cran.r-project.org/web/packages/ggplot2/index.html ggplot2], [https://cran.r-project.org/web/packages/plotly/index.html plotly]</li> | + | <li>R Package: [https://cran.r-project.org/web/packages/hexbin/index.html hexbin], [https://cran.r-project.org/web/packages/ggplot2/index.html ggplot2], [https://cran.r-project.org/web/packages/plotly/index.html plotly]</li> |
<li>Key parameter setting: number of bins is set to 50</li> | <li>Key parameter setting: number of bins is set to 50</li> | ||
<li>Interactivity: Set specific datetime using selectIput and sliderInput to view the traffic density on each floor.<br> | <li>Interactivity: Set specific datetime using selectIput and sliderInput to view the traffic density on each floor.<br> | ||
| Line 106: | Line 103: | ||
<ul> | <ul> | ||
<li>Chart type: Sunburst diagram</li> | <li>Chart type: Sunburst diagram</li> | ||
| − | <li>R Package: sunburstR</li> | + | <li>R Package: [https://cran.r-project.org/web/packages/sunburstR/index.html sunburstR]</li> |
<li>Interactivity: Set radio button to view the journey of different member segments.<br> | <li>Interactivity: Set radio button to view the journey of different member segments.<br> | ||
Set minimum dwell time using sliderInput to exclude passing-by floors.<br> | Set minimum dwell time using sliderInput to exclude passing-by floors.<br> | ||
| Line 121: | Line 118: | ||
<ul> | <ul> | ||
<li>Chart type: Treemap</li> | <li>Chart type: Treemap</li> | ||
| − | <li>R Package: treemap, highCharter </li> | + | <li>R Package: [https://github.com/mtennekes/treemap treemap], [https://github.com/jbkunst/highcharter highCharter] </li> |
<li>Interactivity: Set radio button to view the journey of different member segments.<br> | <li>Interactivity: Set radio button to view the journey of different member segments.<br> | ||
Click on floor level to drill down to store level.<br></li> | Click on floor level to drill down to store level.<br></li> | ||
| Line 130: | Line 127: | ||
</ul> | </ul> | ||
|- | |- | ||
| − | ! scope="row" style="background: #ffffff;"| | + | ! scope="row" style="background: #ffffff;"| |
| + | [[File:T3 Boxplot.JPG|center|300px]] | ||
| | | | ||
<ul> | <ul> | ||
| Line 143: | Line 141: | ||
</ul> | </ul> | ||
|- | |- | ||
| − | ! scope="row" style="background: #ffffff;"| | + | ! scope="row" style="background: #ffffff;"| |
| + | [[File:T3 demobar.JPG|center|300px]] | ||
| | | | ||
<ul> | <ul> | ||
| Line 164: | Line 163: | ||
! scope="col" style="width: 40%; font-family:Century Gothic;"| Usage | ! scope="col" style="width: 40%; font-family:Century Gothic;"| Usage | ||
|- | |- | ||
| − | ! scope="row" style="background: #ffffff;"| | + | ! scope="row" style="background: #ffffff;"| |
| + | [[File:T3 Transbar.JPG|center|300px]] | ||
| | | | ||
<ul> | <ul> | ||
| Line 176: | Line 176: | ||
</ul> | </ul> | ||
|- | |- | ||
| − | ! scope="row" style="background: #ffffff;"| | + | ! scope="row" style="background: #ffffff;"| |
| + | [[File:T3 Quadrant.JPG|center|300px]] | ||
| | | | ||
<ul> | <ul> | ||
<li>Chart type: Scatter plot</li> | <li>Chart type: Scatter plot</li> | ||
| − | <li>R Package: arules, [https://cran.r-project.org/web/packages/ggplot2/index.html ggplot2], [https://cran.r-project.org/web/packages/plotly/index.html plotly]</li> | + | <li>R Package: [https://cran.r-project.org/web/packages/arules/index.html arules], [https://cran.r-project.org/web/packages/ggplot2/index.html ggplot2], [https://cran.r-project.org/web/packages/plotly/index.html plotly]</li> |
<li>Interactivity: Set date range using radio button to generate association rules based on different month’s transactions.<br> | <li>Interactivity: Set date range using radio button to generate association rules based on different month’s transactions.<br> | ||
Set parameters (support/confidence/min items) to generate valid associations rules and render plot. <br> | Set parameters (support/confidence/min items) to generate valid associations rules and render plot. <br> | ||
| Line 196: | Line 197: | ||
<ul> | <ul> | ||
<li>Chart type: Network</li> | <li>Chart type: Network</li> | ||
| − | <li>R Package: visNetwork</li> | + | <li>R Package: [https://github.com/datastorm-open/visNetwork visNetwork]</li> |
| − | <li>Interactivity: Set date range using radio button to plot rules of different months.</li> | + | <li>Interactivity: Set date range using radio button to plot rules of different months.<br> |
| + | Set parameters (support/confidence/min items) to generate valid associations rules and render plot.</li> | ||
</ul> | </ul> | ||
| | | | ||
| Line 204: | Line 206: | ||
</ul> | </ul> | ||
|} | |} | ||
| + | |||
| + | R Packages for Analytics & Visualization: [https://cran.r-project.org/web/packages/ggplot2/index.html ggplot2], [https://cran.r-project.org/web/packages/plotly/index.html plotly], [https://cran.r-project.org/web/packages/sunburstR/index.html sunburstR], [https://cran.r-project.org/web/packages/hexbin/index.html hexbin], [https://github.com/mtennekes/treemap treemap], [https://github.com/jbkunst/highcharter highCharter], [https://cran.r-project.org/web/packages/arules/index.html arules], [https://github.com/datastorm-open/visNetwork visNetwork] | ||
| + | |||
| + | == References == | ||
| + | * RStudio: Integrated Development for R. RStudio, Inc., Boston, MA URL: http://www.rstudio.com/. | ||
| + | * Shiny by RStudio. A web application framework for R: https://shiny.rstudio.com/ | ||
| + | * FootfallCam in Shopping Mall: http://www.footfallcam.com/Industries/ShoppingMalls | ||
| + | * Knowledge Shopping Mall (智慧商场方案): https://wenku.baidu.com/view/5e9ee994f78a6529657d5301.html | ||
| + | * Custom Hexbin Functions with ggplot: http://unconj.ca/blog/custom-hexbin-functions-with-ggplot.html | ||
| + | * Market Basket Analysis with R: http://www.salemmarafi.com/code/market-basket-analysis-with-r/ | ||
| + | * Network visualization with R: http://kateto.net/network-visualization | ||
Latest revision as of 16:04, 6 August 2017
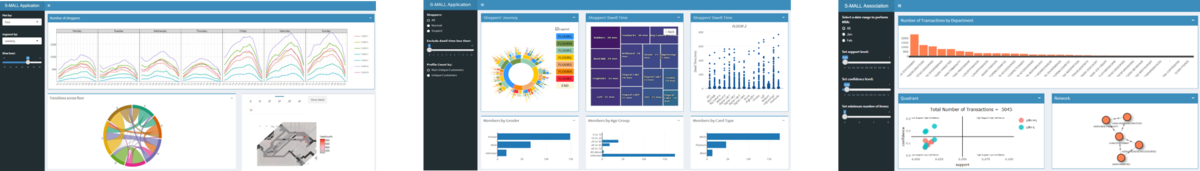
Turning Concrete Malls into Smart Malls (S-MALL):
A web-based analytics application for visualizing and mapping in-mall customer journeys and shopping behaviours
Team S-MALL: Chen Yun-Chen | Chiam Zhan Peng | Zheng Bijun
|
|
|
|
|
APPLICATION OVERVIEW
| Movement Analysis | Member Analysis | Association Analysis |

APPLICATION DESCRIPTION
Part1: Movement Analysis
| Visualization | Methodology & Technique | Usage |
|---|---|---|
 |
| |
 |
|
|
 |
|
Part2: Member Analysis
| Visualization | Methodology & Technique | Usage |
|---|---|---|
 |
|
|
 |
|
|
 |
|
|
 |
|
|
Part3: Association Anlaysis
| Visualization | Methodology & Technique | Usage |
|---|---|---|
 |
| |
 |
|
|
 |
|
|
R Packages for Analytics & Visualization: ggplot2, plotly, sunburstR, hexbin, treemap, highCharter, arules, visNetwork
References
- RStudio: Integrated Development for R. RStudio, Inc., Boston, MA URL: http://www.rstudio.com/.
- Shiny by RStudio. A web application framework for R: https://shiny.rstudio.com/
- FootfallCam in Shopping Mall: http://www.footfallcam.com/Industries/ShoppingMalls
- Knowledge Shopping Mall (智慧商场方案): https://wenku.baidu.com/view/5e9ee994f78a6529657d5301.html
- Custom Hexbin Functions with ggplot: http://unconj.ca/blog/custom-hexbin-functions-with-ggplot.html
- Market Basket Analysis with R: http://www.salemmarafi.com/code/market-basket-analysis-with-r/
- Network visualization with R: http://kateto.net/network-visualization