Difference between revisions of "Shuozhang DataPreparation"
| (One intermediate revision by the same user not shown) | |||
| Line 70: | Line 70: | ||
| − | = | + | =Combining the Data Sets= |
After deciding which data tables are chosen to compare, a combination of two CSV files is performed in R:<br/> | After deciding which data tables are chosen to compare, a combination of two CSV files is performed in R:<br/> | ||
[[File:ShuozhangData manipulation.JPG|350px]] | [[File:ShuozhangData manipulation.JPG|350px]] | ||
| + | |||
<br/> | <br/> | ||
| + | |||
NDVI is calculated in Tableau:<br/> | NDVI is calculated in Tableau:<br/> | ||
[[File:ShuozhangCalculation.JPG|350px]] | [[File:ShuozhangCalculation.JPG|350px]] | ||
Latest revision as of 22:19, 15 July 2017
|
|
|
|
|
Opting out the data files
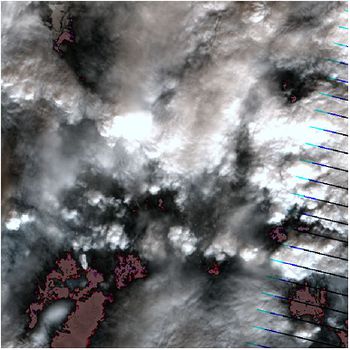
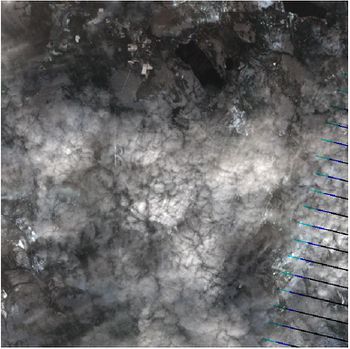
The data from 2014-11-28 and 2015-11-15 has been removed from the analytics process because the weather on that two days are extremely cloudy and the sensor can not detect anything due to that all the band waves cannot penetrate the clouds.
The images for those days are as the follows:
| 2014-11-28: | 2015-11-15: |
|---|---|
 |
 |
Choosing the data files to compare
Since the apparent differences in brightness can occur between dates due to changes in sun angle and atmospheric conditions and the values of specific pixels can change due to a number of factors including Clouds, Atmospheric conditions and etc.
Therefore, the data of the dates that are relatively close in different years are chosen to be analyzed and compared.
At first, a comparison between the images in March is attempted.
Although it was a little bit cloudy that day, the other areas are quite clear.
| 2016-03-06 |
|---|
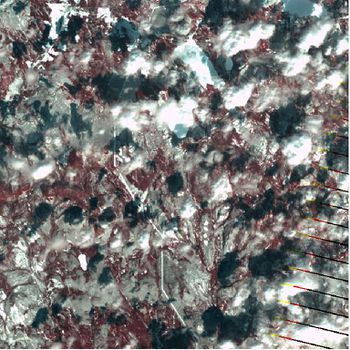 |
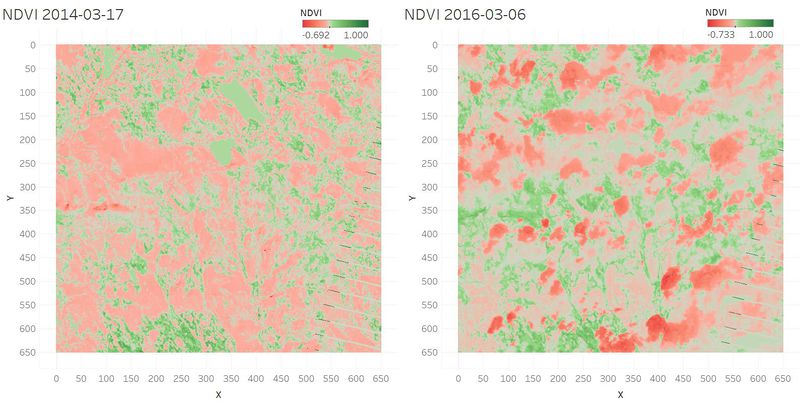
However, when comparing the NDVI values, the images are too blur to drive any conclusions.
Thus, only the images in June and September of 2015 and 2016 are compared respectively.
Combining the Data Sets
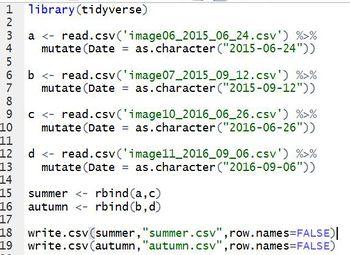
After deciding which data tables are chosen to compare, a combination of two CSV files is performed in R:
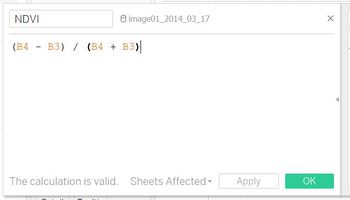
NDVI is calculated in Tableau:

