Difference between revisions of "CAO BO DataPreparation"
Bo.cao.2016 (talk | contribs) |
Bo.cao.2016 (talk | contribs) |
||
| (18 intermediate revisions by the same user not shown) | |||
| Line 7: | Line 7: | ||
| style="font-family:Century Gothic; font-size:100%; solid #000000; background:#002060; text-align:center;" width="25%" | | | style="font-family:Century Gothic; font-size:100%; solid #000000; background:#002060; text-align:center;" width="25%" | | ||
; | ; | ||
| − | [[ISSS608 2016-17 T3 Assign | + | [[ISSS608 2016-17 T3 Assign CAO BO| <font color="#FFFFFF">Background</font>]] |
| − | | style="font-family:Century Gothic; font-size:100%; solid #1B338F; background:# | + | | style="font-family:Century Gothic; font-size:100%; solid #1B338F; background:#C00000; text-align:center;" width="25%" | |
; | ; | ||
| − | [[ | + | [[CAO_BO_DataPreparation| <font color="#FFFFFF">Overview & Data Preparation</font>]] |
| style="font-family:Century Gothic; font-size:100%; solid #1B338F; background:#002060; text-align:center;" width="25%" | | | style="font-family:Century Gothic; font-size:100%; solid #1B338F; background:#002060; text-align:center;" width="25%" | | ||
| Line 19: | Line 19: | ||
| style="font-family:Century Gothic; font-size:100%; solid #1B338F; background:#002060; text-align:center;" width="25%" | | | style="font-family:Century Gothic; font-size:100%; solid #1B338F; background:#002060; text-align:center;" width="25%" | | ||
; | ; | ||
| − | [[CAO_BO_Comments| <font color="#FFFFFF">Comments</font>]] | + | [[CAO_BO_Comments| <font color="#FFFFFF">Comments & References</font>]] |
| | | | ||
| Line 29: | Line 29: | ||
==Data Overview== | ==Data Overview== | ||
===Traffic Movement Data=== | ===Traffic Movement Data=== | ||
| − | [[File:Cb_dataoverview.PNG| | + | [[File:Cb_dataoverview.PNG|800px|center]] |
==Data Discription== | ==Data Discription== | ||
| Line 48: | Line 48: | ||
<table cellspacing="10" border="1"> | <table cellspacing="10" border="1"> | ||
<tr> | <tr> | ||
| − | <td> Exclusion criterion: (1) id without full movement records( all visitors should come in and get out from both entrances so those ids that only have one entrance should be excluded).(2)id without full timestamp records.( those id without the come in and get out records).(3) repeat records | + | <td> |
| + | Exclusion criterion: | ||
| + | |||
| + | (1) id without full movement records( all visitors should come in and get out from both entrances so those ids that only have one entrance should be excluded). | ||
| + | |||
| + | (2)id without full timestamp records.( those id without the come in and get out records). | ||
| + | |||
| + | (3) repeat records | ||
<td>[[File:Entrances number2.PNG|700px|right]]</td> | <td>[[File:Entrances number2.PNG|700px|right]]</td> | ||
</tr> | </tr> | ||
| Line 64: | Line 71: | ||
<tr> | <tr> | ||
<td> Number the movement order for each car-id and then list the car-id with episode. | <td> Number the movement order for each car-id and then list the car-id with episode. | ||
| + | |||
| + | Level: The order of movement(entrance---gate :level of entrance is one and the level of gate is two) | ||
| + | |||
| + | Episode: Each entrance & exit is one episode, so normally each id should has only one episode. | ||
<td>[[File:Level_and_eposide.PNG|800px|right]]</td> | <td>[[File:Level_and_eposide.PNG|800px|right]]</td> | ||
</tr> | </tr> | ||
</table> | </table> | ||
| − | === | + | |
| + | ===Compute the last duration, camping hour and single checkpoint duration=== | ||
<table cellspacing="10" border="1"> | <table cellspacing="10" border="1"> | ||
<tr> | <tr> | ||
| − | <td> Compute the multipul duration in excel for better visualization.Last duration(day),camping hour(hour),single checkpoint duration( | + | <td> Compute the multipul duration in excel for better visualization.Last duration(day),camping hour(hour),single checkpoint duration(min) |
<td>[[File:Camping hour.PNG|800px|right]]</td> | <td>[[File:Camping hour.PNG|800px|right]]</td> | ||
</tr> | </tr> | ||
</table> | </table> | ||
| + | |||
===Coordinates Extractation and Preparation for Gephi=== | ===Coordinates Extractation and Preparation for Gephi=== | ||
<table cellspacing="10" border="1"> | <table cellspacing="10" border="1"> | ||
<tr> | <tr> | ||
<td> Extract the coordinates in tableau and then prepare the coordinates for Gephi visualization | <td> Extract the coordinates in tableau and then prepare the coordinates for Gephi visualization | ||
| − | <td>[[File:Gephi.PNG| | + | <td>[[File:Gephi.PNG|600px|right]]</td> |
| + | </tr> | ||
| + | </table> | ||
| + | |||
| + | ===Participent Segamentation=== | ||
| + | <table cellspacing="10" border="1"> | ||
| + | <tr> | ||
| + | <td> All the participents are classified into Camper,No-camper and Ranger | ||
| + | <td>[[File:Visitors type.PNG|700px|right]]</td> | ||
</tr> | </tr> | ||
</table> | </table> | ||
Latest revision as of 19:45, 16 July 2017
|
|
|
|
|
Contents
- 1 Map View
- 2 Data Overview
- 3 Data Discription
- 4 Step by Step Discription
- 4.1 Exclude misleading records
- 4.2 Extract the car sequences
- 4.3 Label vehicles in their movement order and then create Episode based on the movement order and id
- 4.4 Compute the last duration, camping hour and single checkpoint duration
- 4.5 Coordinates Extractation and Preparation for Gephi
- 4.6 Participent Segamentation
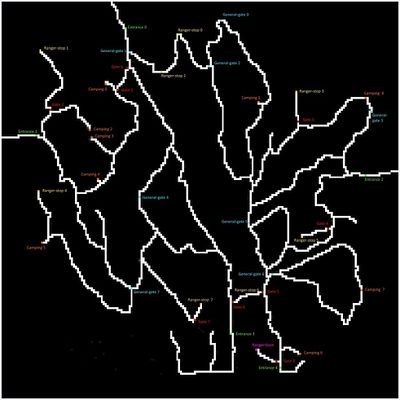
Map View
Data Overview
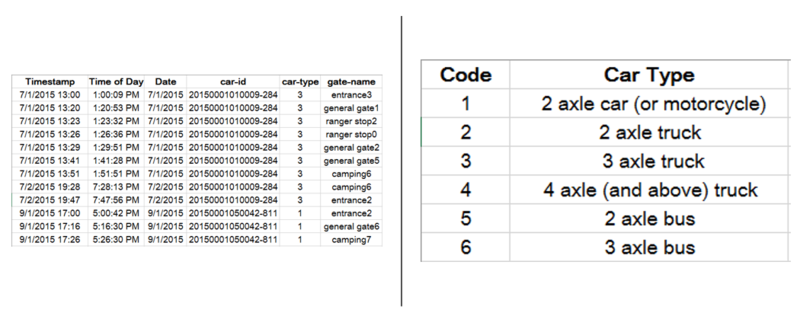
Traffic Movement Data
Data Discription
Entry gates are positioned at the Preserve entrances. Each vehicle receives an entry ticket at the gate and is assigned a vehicle class; the entry is recorded. The entry ticket contains an RF-tag that enables the Preserve sensors to pick up the passage of a vehicle through the Preserve. Each vehicle surrenders their entry ticket when exiting the Preserve and the exit is recorded.When vehicles enter the Preserve, they must proceed through a gate and obtain a pass.
Details Discription
1. Entrances: All vehicles pass through an Entrance when entering or leaving the Preserve.
2. General-gates: All vehicles may pass through these gates. These sensors provide valuable information for the Preserve Rangers trying to understand the flow of traffic through the Preserve.
3. Gates: These are gates that prevent general traffic from passing. Preserve Ranger vehicles have tags that allow them to pass through these gates to inspect or perform work on the roadway beyond.
4. Ranger-stops: These sensors represent working areas for the Rangers, so you will often see a Ranger-stop sensor at the end of a road managed by a Gate. Some Ranger-stops are in other locations, however, so these sensors record all traffic passing by.
5. Camping: These sensors record visitors to the Preserve camping areas. Visitors pass by these entering and exiting a campground.
Step by Step Discription
Exclude misleading records
|
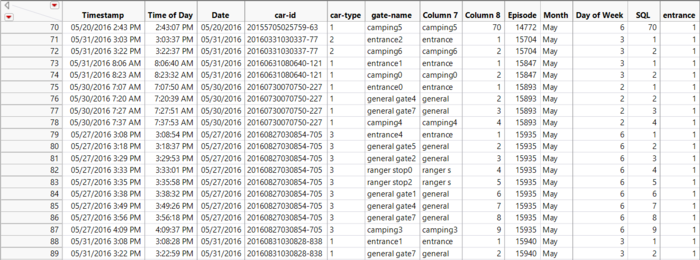
Exclusion criterion: (1) id without full movement records( all visitors should come in and get out from both entrances so those ids that only have one entrance should be excluded). (2)id without full timestamp records.( those id without the come in and get out records). (3) repeat records |
Extract the car sequences
| The most essentail step for data preparation is to extract the car sequences which helps to summary the life patterns. This step is conducted in JMP with the function[Col Rank(Timestamp,car-id)] |
Label vehicles in their movement order and then create Episode based on the movement order and id
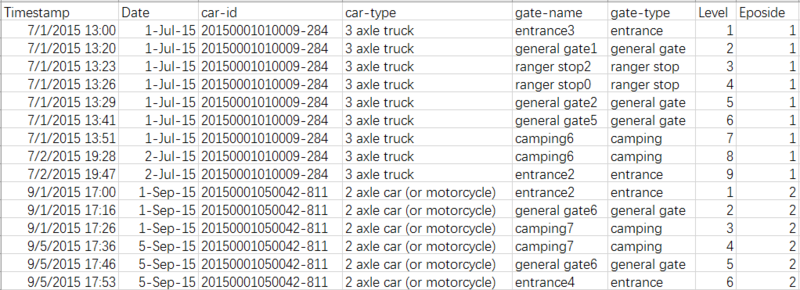
| Number the movement order for each car-id and then list the car-id with episode.
Level: The order of movement(entrance---gate :level of entrance is one and the level of gate is two) Episode: Each entrance & exit is one episode, so normally each id should has only one episode. |
Compute the last duration, camping hour and single checkpoint duration
| Compute the multipul duration in excel for better visualization.Last duration(day),camping hour(hour),single checkpoint duration(min) |
Coordinates Extractation and Preparation for Gephi
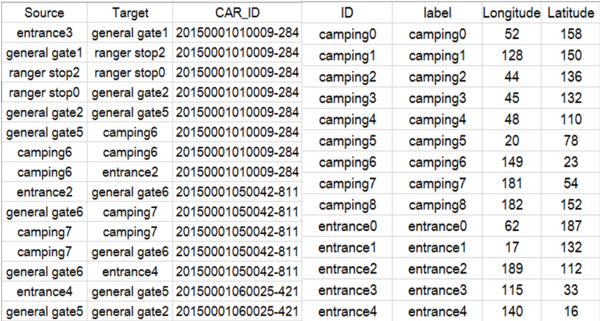
| Extract the coordinates in tableau and then prepare the coordinates for Gephi visualization |
Participent Segamentation
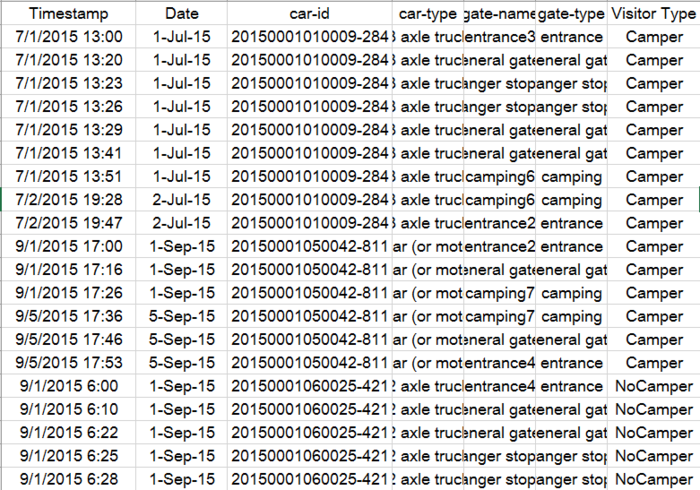
| All the participents are classified into Camper,No-camper and Ranger |

