Difference between revisions of "ISSS608 2016-17 T3 Group8 Arules Application"
Bo.cao.2016 (talk | contribs) (Created page with "<div style=background:#881332 border:#A3BFB1> 200px <b><font size = 6; color="#FFFAF0">A Visual Application for Better Business Decision Making...") |
Yfguan.2016 (talk | contribs) |
||
| (3 intermediate revisions by 2 users not shown) | |||
| Line 7: | Line 7: | ||
| style="font-family:Century Gothic; font-size:100%; solid #000000; background:#000000; text-align:center;" width="25%" | | | style="font-family:Century Gothic; font-size:100%; solid #000000; background:#000000; text-align:center;" width="25%" | | ||
; | ; | ||
| − | [[ISSS608_2016-17_T3_Group8_Arules_Introduction|<b><font size=" | + | [[ISSS608_2016-17_T3_Group8_Arules_Introduction|<b><font size="2"><font color="#FFFAF0">Introduction</font></font></b>]] |
| style="font-family:Century Gothic; font-size:100%; solid #1B338F; background:#000000; text-align:center;" width="25%" | | | style="font-family:Century Gothic; font-size:100%; solid #1B338F; background:#000000; text-align:center;" width="25%" | | ||
| Line 24: | Line 24: | ||
|} | |} | ||
<br/> | <br/> | ||
| + | |||
| + | ==Our Application== | ||
| + | [https://vrshiny.shinyapps.io/vrshiny/ VRshiny Application: You are welcomed to click the link here to try out our application VRshiny yourself. Have fun!] | ||
| + | |||
| + | <table> | ||
| + | <table border='1'> | ||
| + | <tr> | ||
| + | <th>Design Concepts</th> | ||
| + | <th>Dashboard</th> | ||
| + | </tr> | ||
| + | <tr> | ||
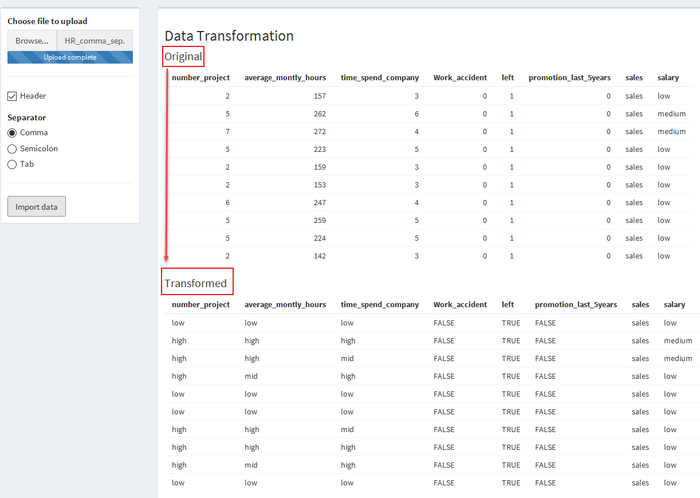
| + | <td><b>1.Load data dashboard</b> | ||
| + | This dashboard allows the user to load their data for using our app | ||
| + | <br> | ||
| + | It has to be highlighted that only categorical variables are accepted by arules package for doing association rule mining. We thus provided a functionality to transform the numeric variables and binary numeric variables to categorical variables first at the data importing stage. | ||
| + | |||
| + | <br> | ||
| + | The screen displays the original data uploaded and the transformed data (if it contains numeric variables) | ||
| + | |||
| + | <br> | ||
| + | The transformation process will be discussed in the next section on the detailed application designs. | ||
| + | |||
| + | </td> | ||
| + | <td>[[File:VRshiny_report_grp8_files_image013.png|700px|center]]</td> | ||
| + | </tr> | ||
| + | <tr> | ||
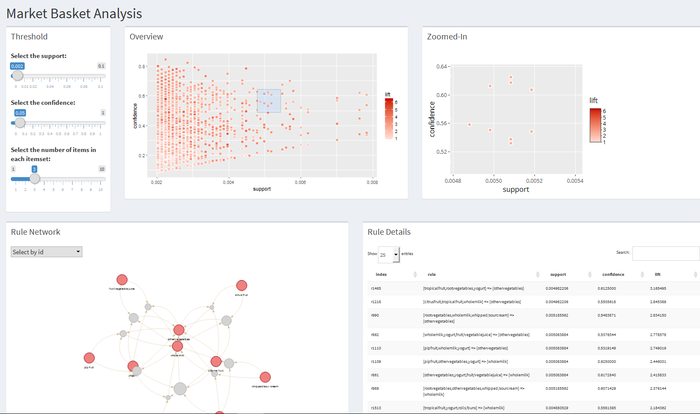
| + | <td> <b>2.Dashboard for generic market basket analysis</b> | ||
| + | This dashboard is designed for the generic MBA analysis, where we allow the users to have an overview of the individual rules before they choose one particular area to investigate. | ||
| + | |||
| + | <br> | ||
| + | The zoom-in scatter plot, the network visualization and the data table will be filtered based on the selected box in the first overview scatterplot. | ||
| + | |||
| + | </td> | ||
| + | <td>[[File:VRshiny_report_grp8_files_image015.png|700px|center]]</td> | ||
| + | </tr> | ||
| + | <tr> | ||
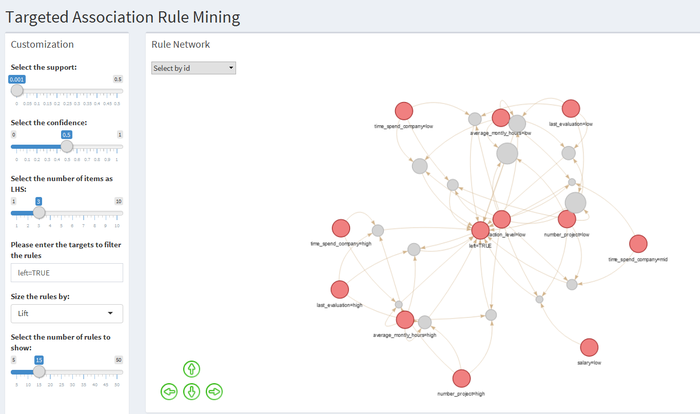
| + | <td> <b>3.Dashboard for Targeted ARM</b> | ||
| + | This dashboard is designed for the targeted ARM analysis. Since the targeted ARM already has an targeted item of interest, we skipped the stats explorer part but added in more interactive features for the users to calibrate the model and investigate the items of their interest. | ||
| + | <br> | ||
| + | |||
| + | For example, the user can choose to view only the association network of the rules leading to a specific target variable. | ||
| + | |||
| + | <br> | ||
| + | A datatable indicating the three interestingness measures of each rule is included at the bottom of the network graph visualization. | ||
| + | |||
| + | </td> | ||
| + | <td>[[File:VRshiny_report_grp8_files_image017.png|700px|center]]</td> | ||
| + | </tr> | ||
| + | </table> | ||
Latest revision as of 11:24, 8 August 2017
|
|
|
|
|
Our Application
| Design Concepts | Dashboard |
|---|---|
| 1.Load data dashboard
This dashboard allows the user to load their data for using our app
|
|
| 2.Dashboard for generic market basket analysis
This dashboard is designed for the generic MBA analysis, where we allow the users to have an overview of the individual rules before they choose one particular area to investigate.
|
|
| 3.Dashboard for Targeted ARM
This dashboard is designed for the targeted ARM analysis. Since the targeted ARM already has an targeted item of interest, we skipped the stats explorer part but added in more interactive features for the users to calibrate the model and investigate the items of their interest.
For example, the user can choose to view only the association network of the rules leading to a specific target variable.
|


