Difference between revisions of "S-MALL User Guide"
Jump to navigation
Jump to search
Zpchiam.2016 (talk | contribs) |
Ycchen.2016 (talk | contribs) |
||
| (One intermediate revision by one other user not shown) | |||
| Line 4: | Line 4: | ||
<p><font size = 3; color="#FFFFFF"><span style="font-family:Century Gothic;">Team S-MALL: Chen Yun-Chen | Chiam Zhan Peng | Zheng Bijun</span></font></p> | <p><font size = 3; color="#FFFFFF"><span style="font-family:Century Gothic;">Team S-MALL: Chen Yun-Chen | Chiam Zhan Peng | Zheng Bijun</span></font></p> | ||
</div> | </div> | ||
| − | {|style="background-color:# | + | {|style="background-color:#565656;" width="100%" cellspacing="0" cellpadding="0" valign="top" border="0" | |
| style="font-family:Century Gothic; font-size:100%; solid #000000; background:#565656; text-align:center;" width="25%" | | | style="font-family:Century Gothic; font-size:100%; solid #000000; background:#565656; text-align:center;" width="25%" | | ||
; | ; | ||
| Line 12: | Line 12: | ||
; | ; | ||
[[S-MALL_Application| <font color="#FFFFFF">Application</font>]] | [[S-MALL_Application| <font color="#FFFFFF">Application</font>]] | ||
| + | |||
| + | | style="font-family:Century Gothic; font-size:100%; solid #1B338F; background:#2e5b84; text-align:center;" width="25%" | | ||
| + | ; | ||
| + | [[S-MALL_User Guide| <font color="#FFFFFF">User Guide</font>]] | ||
| style="font-family:Century Gothic; font-size:100%; solid #1B338F; background:#565656; text-align:center;" width="25%" | | | style="font-family:Century Gothic; font-size:100%; solid #1B338F; background:#565656; text-align:center;" width="25%" | | ||
; | ; | ||
[[S-MALL_Poster| <font color="#FFFFFF">Poster</font>]] | [[S-MALL_Poster| <font color="#FFFFFF">Poster</font>]] | ||
| − | |||
| − | |||
| − | |||
| − | |||
| | | | ||
|} | |} | ||
| + | |||
== APPLICATION == | == APPLICATION == | ||
<table width=100%> | <table width=100%> | ||
| Line 171: | Line 172: | ||
| | | | ||
<ul> | <ul> | ||
| − | <li>Analyze the | + | <li>Analyze the 4 different quadrant position of different rules based on selected 3 parameters.</li> |
</ul> | </ul> | ||
|- | |- | ||
Latest revision as of 10:05, 7 August 2017
Turning Concrete Malls into Smart Malls (S-MALL):
A web-based analytics application for visualizing and mapping in-mall customer journeys and shopping behaviours
Team S-MALL: Chen Yun-Chen | Chiam Zhan Peng | Zheng Bijun
|
|
|
|
|
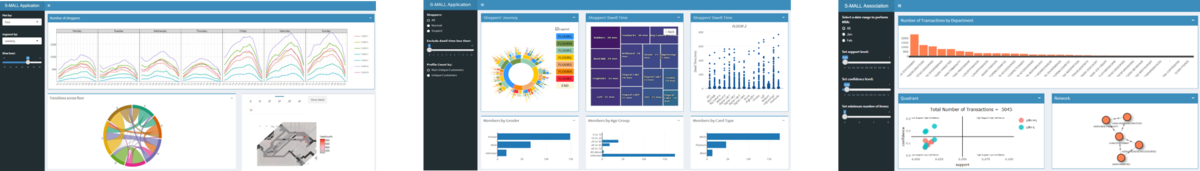
APPLICATION
| Movement Analysis | Member Analysis | Association Analysis |

USER GUIDE
Part1: Movement Analysis
| Screenshot | Guidance |
|---|---|
 |
|
 |
|
 |
|
 |
|
 |
|
 |
|
Part2: Member Analysis
| Screenshot | Guidance |
|---|---|
 |
|
 |
|
 |
|
 |
|
 |
|
Part3: Association Analysis
| Screenshot | Guidance |
|---|---|
 |
|
 |
|
 |
|
 |
|
 |
|