Difference between revisions of "S-MALL User Guide"

From Visual Analytics and Applications
Jump to navigation Jump to search
 
(6 intermediate revisions by 2 users not shown)
Line 16: Line 16:
 
;  
 
;  
 
[[S-MALL_User Guide| <font color="#FFFFFF">User Guide</font>]]  
 
[[S-MALL_User Guide| <font color="#FFFFFF">User Guide</font>]]  
 
+
 
| style="font-family:Century Gothic; font-size:100%; solid #1B338F; background:#565656; text-align:center;" width="25%" |   
 
| style="font-family:Century Gothic; font-size:100%; solid #1B338F; background:#565656; text-align:center;" width="25%" |   
 
;  
 
;  
Line 23: Line 23:
 
|  &nbsp;  
 
|  &nbsp;  
 
|}  
 
|}  
 +
 
== APPLICATION ==
 
== APPLICATION ==
 
<table width=100%>
 
<table width=100%>
Line 32: Line 33:
 
</table>
 
</table>
 
[[File:T3 Appoverview.png|center|1200px]]
 
[[File:T3 Appoverview.png|center|1200px]]
 
 
Editing S-MALL Future Work (section)
 
WikitextPreviewChangesPublishCancel
 
BoldItalicSignature and timestampLinkEmbedded fileReferenceAdvancedSpecial charactersHelp


== USER GUIDE ==
 
== USER GUIDE ==
Line 153: Line 149:
 
<ul>
 
<ul>
 
<li>Set date range using radio button to see the plot of different months.</li>
 
<li>Set date range using radio button to see the plot of different months.</li>
<li>Set parameters (support/confidence/min items) to generate valid associations rules and render plot forquadrant and network. </li>
+
<li>Set parameters (support/confidence/min items) to generate the valid associations rules and render plot for Quadrant and Network graph. </li>
 
</ul>
 
</ul>
 
|-
 
|-
Line 160: Line 156:
 
|  
 
|  
 
<ul>
 
<ul>
<li>Investigate popular shopping path of members based on floors.</li>
+
<li>Investigate the ranked number of transactions of members.</li>
<li>Hover over the bar to fade out non-relevant rules in the quadrant as following.</li>
+
<li>Hover over any of the selected bar to view the number of transactions; it will show only relevant rules and fade out non-relevant rules in the quadrant.</li>
 
</ul>
 
</ul>
 
|-
 
|-
Line 168: Line 164:
 
|  
 
|  
 
<ul>
 
<ul>
<li>Visualize the associations among departments.</li>
+
<li>Visualize the associations rules among departments based on selected 3 parameters. Department are illustrated using nodes in circle and directional arrows using edge.</li>
<li>Hover over the network to fade out non-relevant rules in the quadrant as following.</li>
+
<li>Hover over any of the node (circle) in the network graph; it will show only relevant rules and fade out non-relevant rules in the quadrant graph.</li>
 
</ul>
 
</ul>
 
|-
 
|-
Line 176: Line 172:
 
|  
 
|  
 
<ul>
 
<ul>
<li>Analyze the competitive position of different rules based on set parameters.</li>
+
<li>Analyze the 4 different quadrant position of different rules based on selected 3 parameters.</li>
 
</ul>
 
</ul>
 
|-
 
|-
Line 183: Line 179:
 
|  
 
|  
 
<ul>
 
<ul>
<li>Detail information of different rules based on set parameters.</li>
+
<li>Click on "Table" to show detailed information such as Chi-square value of different rules based on set parameters.</li>
 
</ul>
 
</ul>
 
|-
 
|-
 
|}
 
|}
 
Please be patient.
 
 
Summary:
 
/* USER GUIDE */
 
This is a minor edit  Watch this page
 
Please note that all contributions to Visual Analytics and Applications may be edited, altered, or removed by other contributors. If you do not want your writing to be edited mercilessly, then do not submit it here.
 
You are also promising us that you wrote this yourself, or copied it from a public domain or similar free resource (see Visual Analytics and Applications:Copyrights for details). Do not submit copyrighted work without permission!
 
Save page Show preview  Show changes Cancel
 
Navigation menu
 
Zpchiam.2016TalkPreferencesWatchlistContributionsLog outPageDiscussionReadEditView historyUnwatch
 
 
Search
 
Go
 
Main Page
 
Course information
 
Project Groups
 
Recent changes
 
Terms of use
 
Wiki Policy
 
Intellectual Property
 
Help
 
Tools
 
What links here
 
Related changes
 
Upload file
 
Special pages
 
Page information
 
Privacy policyAbout Visual Analytics and ApplicationsDisclaimersPowered by MediaWiki
 

Latest revision as of 10:05, 7 August 2017

Turning Concrete Malls into Smart Malls (S-MALL):
A web-based analytics application for visualizing and mapping in-mall customer journeys and shopping behaviours

Team S-MALL: Chen Yun-Chen | Chiam Zhan Peng | Zheng Bijun
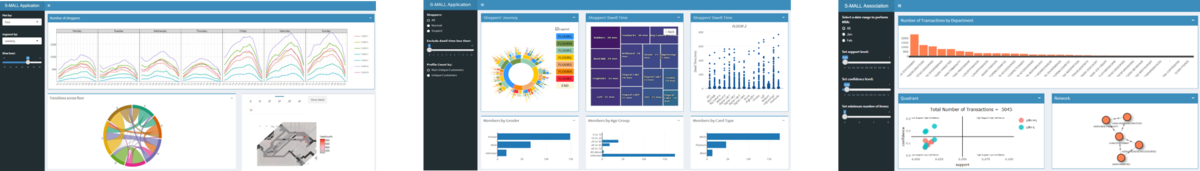
Overview

Application

User Guide

Poster


APPLICATION

Movement Analysis Member Analysis Association Analysis
T3 Appoverview.png

USER GUIDE

Part1: Movement Analysis

Screenshot Guidance
T3 Part1 control.PNG
  • "Plot by" and "Segment by" dropdown are used for line chart. Select "Segment by" will show cycle plot accordingly.
  • "View" and "View hour" dropdown are for selecting date and hour respectively and display the inter-flow movement and hexbin map for that selected date and hour.
T3 Trellis.JPG
  • Hover on any points on the line chart to display the tooltip for detailed information.
T3 Part1 chord.PNG
  • Hover on the chorddiagram to display the tooltip for detailed information.
  • Example: There are 61 customers moving from 3F to 2F and 57 customers moving from 2F to 3F at selected time.
T3 HexbinMap.jpg
  • Zoom in by selecting area with left click hold and release as required and click on any hexbin for the selected hexbin to be captured.
  • Click on "Show Detail" button to show the distribution of the selected hexbin. Members and Non-members count will be displayed.
T3 Part1 bar.PNG
  • Click on the bar chart to show detailed information such as their Device ID and number of counts.
T3 Part1 table.jpg
  • "Count" means the customer stays in selected hexbin for how long (min) in selected time interval.


Part2: Member Analysis

Screenshot Guidance
T3 Part2 control.PNG
  • Selection "All" of Operating Hours: Displays Members records for during and outside operating hours.
  • Selection "Normal" of Operating Hours: Displays Members records who only appear during operating hours (1000 to 2200).
  • Selection "Outside" of Operating Hours: Displays Members records who appears outside of operating hours (1000 to 2200).
  • Exclude dwell time less then: This slider control is for Shopper's Journey in Sunburst chart only. It is used to exclude those records which only stay in a particular floor for the selected minutes.
  • Profile Count by: This control panel is for member distribution. Non-Unique Customers: Count by records. Unique Customers: Count by member ID.
T3 Part2 sunburst.PNG
  • Hover to see the path and relevant statistics.
  • Example: There are 23 of 2.2k journeys which start from FLOOR M and go to FLOOR G then go to FLOOR 2.
T3 Part2 treemap.PNG
  • Click on floor level to drill down to store level.
  • Click on any store to show the relevant boxplot on the left for selected floor as following.
T3 Part2 boxplot.PNG
  • Select records you are interested in to show the relevant distribution(bar chart) as following.
T3 demobar.JPG
  • The 3 bar charts will change automatically with the selected area. View the distribution of the Profile of Gender, Age Group and Card Type.

Part3: Association Analysis

Screenshot Guidance
T3 Part3 control.PNG
  • Set date range using radio button to see the plot of different months.
  • Set parameters (support/confidence/min items) to generate the valid associations rules and render plot for Quadrant and Network graph.
T3 Part3 bar.PNG
  • Investigate the ranked number of transactions of members.
  • Hover over any of the selected bar to view the number of transactions; it will show only relevant rules and fade out non-relevant rules in the quadrant.
T3 Part3 node.PNG
  • Visualize the associations rules among departments based on selected 3 parameters. Department are illustrated using nodes in circle and directional arrows using edge.
  • Hover over any of the node (circle) in the network graph; it will show only relevant rules and fade out non-relevant rules in the quadrant graph.
T3 Part3 qua.PNG
  • Analyze the 4 different quadrant position of different rules based on selected 3 parameters.
Part3 table.PNG
  • Click on "Table" to show detailed information such as Chi-square value of different rules based on set parameters.