Difference between revisions of "S-MALL User Guide"
Jump to navigation
Jump to search
Ycchen.2016 (talk | contribs) (Created page with "<div style="background:#565656; border:#565656; padding-left:15px; text-align:center;"> <font size = 5; color="#FFFFFF"><span style="font-family:Century Gothic;">Turning Conc...") |
Ycchen.2016 (talk | contribs) |
||
| (11 intermediate revisions by 2 users not shown) | |||
| Line 4: | Line 4: | ||
<p><font size = 3; color="#FFFFFF"><span style="font-family:Century Gothic;">Team S-MALL: Chen Yun-Chen | Chiam Zhan Peng | Zheng Bijun</span></font></p> | <p><font size = 3; color="#FFFFFF"><span style="font-family:Century Gothic;">Team S-MALL: Chen Yun-Chen | Chiam Zhan Peng | Zheng Bijun</span></font></p> | ||
</div> | </div> | ||
| − | {|style="background-color:# | + | {|style="background-color:#565656;" width="100%" cellspacing="0" cellpadding="0" valign="top" border="0" | |
| style="font-family:Century Gothic; font-size:100%; solid #000000; background:#565656; text-align:center;" width="25%" | | | style="font-family:Century Gothic; font-size:100%; solid #000000; background:#565656; text-align:center;" width="25%" | | ||
; | ; | ||
| Line 12: | Line 12: | ||
; | ; | ||
[[S-MALL_Application| <font color="#FFFFFF">Application</font>]] | [[S-MALL_Application| <font color="#FFFFFF">Application</font>]] | ||
| + | |||
| + | | style="font-family:Century Gothic; font-size:100%; solid #1B338F; background:#2e5b84; text-align:center;" width="25%" | | ||
| + | ; | ||
| + | [[S-MALL_User Guide| <font color="#FFFFFF">User Guide</font>]] | ||
| style="font-family:Century Gothic; font-size:100%; solid #1B338F; background:#565656; text-align:center;" width="25%" | | | style="font-family:Century Gothic; font-size:100%; solid #1B338F; background:#565656; text-align:center;" width="25%" | | ||
; | ; | ||
[[S-MALL_Poster| <font color="#FFFFFF">Poster</font>]] | [[S-MALL_Poster| <font color="#FFFFFF">Poster</font>]] | ||
| − | |||
| − | |||
| − | |||
| − | |||
| | | | ||
|} | |} | ||
| + | |||
== APPLICATION == | == APPLICATION == | ||
<table width=100%> | <table width=100%> | ||
| Line 33: | Line 34: | ||
[[File:T3 Appoverview.png|center|1200px]] | [[File:T3 Appoverview.png|center|1200px]] | ||
| − | == GUIDE == | + | == USER GUIDE == |
Part1: Movement Analysis | Part1: Movement Analysis | ||
{| class="wikitable" | {| class="wikitable" | ||
| Line 44: | Line 45: | ||
| | | | ||
<ul> | <ul> | ||
| − | <li>Plot by and Segment by are for line chart. | + | <li>"Plot by" and "Segment by" dropdown are used for line chart. Select "Segment by" will show cycle plot accordingly.</li> |
| − | <li>View | + | <li>"View" and "View hour" dropdown are for selecting date and hour respectively and display the inter-flow movement and hexbin map for that selected date and hour.</li> |
</ul> | </ul> | ||
|- | |- | ||
| Line 52: | Line 53: | ||
| | | | ||
<ul> | <ul> | ||
| − | <li>Hover on | + | <li>Hover on any points on the line chart to display the tooltip for detailed information.</li> |
</ul> | </ul> | ||
|- | |- | ||
| Line 59: | Line 60: | ||
| | | | ||
<ul> | <ul> | ||
| − | <li>Hover on the | + | <li>Hover on the chorddiagram to display the tooltip for detailed information.</li> |
<li>Example: There are 61 customers moving from 3F to 2F and 57 customers moving from 2F to 3F at selected time.</li> | <li>Example: There are 61 customers moving from 3F to 2F and 57 customers moving from 2F to 3F at selected time.</li> | ||
</ul> | </ul> | ||
| Line 67: | Line 68: | ||
| | | | ||
<ul> | <ul> | ||
| − | <li>Click on | + | <li>Zoom in by selecting area with left click hold and release as required and click on any hexbin for the selected hexbin to be captured.</li> |
| + | <li>Click on "Show Detail" button to show the distribution of the selected hexbin. Members and Non-members count will be displayed. </li> | ||
</ul> | </ul> | ||
|- | |- | ||
! scope="row" style="background: #ffffff;"| | ! scope="row" style="background: #ffffff;"| | ||
| − | [[File:T3 Part1 bar. | + | [[File:T3 Part1 bar.PNG|center|300px]] |
| | | | ||
<ul> | <ul> | ||
| − | <li>Click on bar to show | + | <li>Click on the bar chart to show detailed information such as their Device ID and number of counts. </li> |
</ul> | </ul> | ||
|- | |- | ||
| Line 81: | Line 83: | ||
| | | | ||
<ul> | <ul> | ||
| − | <li>Count means the customer stays in selected hexbin for how long (min) in selected time interval.</li> | + | <li>"Count" means the customer stays in selected hexbin for how long (min) in selected time interval.</li> |
</ul> | </ul> | ||
|- | |- | ||
| Line 97: | Line 99: | ||
| | | | ||
<ul> | <ul> | ||
| − | <li>Selection All | + | <li>Selection "All" of Operating Hours: Displays Members records for during and outside operating hours. </li> |
| − | <li>Selection Normal | + | <li>Selection "Normal" of Operating Hours: Displays Members records who only appear during operating hours (1000 to 2200).</li> |
| − | <li>Selection Outside | + | <li>Selection "Outside" of Operating Hours: Displays Members records who appears outside of operating hours (1000 to 2200).</li> |
| − | <li>Exclude dwell time less then: This control | + | <li>Exclude dwell time less then: This slider control is for Shopper's Journey in Sunburst chart only. It is used to exclude those records which only stay in a particular floor for the selected minutes.</li> |
<li>Profile Count by: This control panel is for member distribution. Non-Unique Customers: Count by records. Unique Customers: Count by member ID.</li> | <li>Profile Count by: This control panel is for member distribution. Non-Unique Customers: Count by records. Unique Customers: Count by member ID.</li> | ||
</ul> | </ul> | ||
| Line 117: | Line 119: | ||
<ul> | <ul> | ||
<li>Click on floor level to drill down to store level.</li> | <li>Click on floor level to drill down to store level.</li> | ||
| − | <li>Click on any store to show the relevant boxplot for selected floor as following.</li> | + | <li>Click on any store to show the relevant boxplot on the left for selected floor as following.</li> |
</ul> | </ul> | ||
|- | |- | ||
| Line 131: | Line 133: | ||
| | | | ||
<ul> | <ul> | ||
| − | <li> | + | <li>The 3 bar charts will change automatically with the selected area. View the distribution of the Profile of Gender, Age Group and Card Type.</li> |
</ul> | </ul> | ||
|- | |- | ||
| Line 147: | Line 149: | ||
<ul> | <ul> | ||
<li>Set date range using radio button to see the plot of different months.</li> | <li>Set date range using radio button to see the plot of different months.</li> | ||
| − | <li>Set parameters (support/confidence/min items) to generate valid associations rules and render plot | + | <li>Set parameters (support/confidence/min items) to generate the valid associations rules and render plot for Quadrant and Network graph. </li> |
</ul> | </ul> | ||
|- | |- | ||
| Line 154: | Line 156: | ||
| | | | ||
<ul> | <ul> | ||
| − | <li>Investigate | + | <li>Investigate the ranked number of transactions of members.</li> |
| − | <li>Hover over the bar to fade out non-relevant rules in the quadrant | + | <li>Hover over any of the selected bar to view the number of transactions; it will show only relevant rules and fade out non-relevant rules in the quadrant.</li> |
</ul> | </ul> | ||
|- | |- | ||
| Line 162: | Line 164: | ||
| | | | ||
<ul> | <ul> | ||
| − | <li>Visualize the associations among departments.</li> | + | <li>Visualize the associations rules among departments based on selected 3 parameters. Department are illustrated using nodes in circle and directional arrows using edge.</li> |
| − | <li>Hover over the network | + | <li>Hover over any of the node (circle) in the network graph; it will show only relevant rules and fade out non-relevant rules in the quadrant graph.</li> |
</ul> | </ul> | ||
|- | |- | ||
| Line 170: | Line 172: | ||
| | | | ||
<ul> | <ul> | ||
| − | <li>Analyze the | + | <li>Analyze the 4 different quadrant position of different rules based on selected 3 parameters.</li> |
</ul> | </ul> | ||
|- | |- | ||
| Line 177: | Line 179: | ||
| | | | ||
<ul> | <ul> | ||
| − | <li> | + | <li>Click on "Table" to show detailed information such as Chi-square value of different rules based on set parameters.</li> |
</ul> | </ul> | ||
|- | |- | ||
|} | |} | ||
| − | |||
| − | |||
Latest revision as of 10:05, 7 August 2017
Turning Concrete Malls into Smart Malls (S-MALL):
A web-based analytics application for visualizing and mapping in-mall customer journeys and shopping behaviours
Team S-MALL: Chen Yun-Chen | Chiam Zhan Peng | Zheng Bijun
|
|
|
|
|
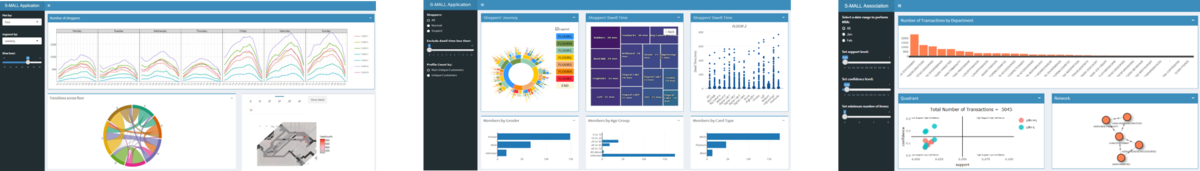
APPLICATION
| Movement Analysis | Member Analysis | Association Analysis |

USER GUIDE
Part1: Movement Analysis
| Screenshot | Guidance |
|---|---|
 |
|
 |
|
 |
|
 |
|
 |
|
 |
|
Part2: Member Analysis
| Screenshot | Guidance |
|---|---|
 |
|
 |
|
 |
|
 |
|
 |
|
Part3: Association Analysis
| Screenshot | Guidance |
|---|---|
 |
|
 |
|
 |
|
 |
|
 |
|