Difference between revisions of "Group 4 - Application"
| (3 intermediate revisions by 2 users not shown) | |||
| Line 1: | Line 1: | ||
<div style="background:#2b8474; border:#2b8474; text-align:center; font-family:Century Gothic;"> | <div style="background:#2b8474; border:#2b8474; text-align:center; font-family:Century Gothic;"> | ||
| − | [[Image:group_4_title.jpg| | + | [[Image:group_4_title.jpg|126px|left]] |
| − | <font size = | + | <font size = 5; color="#FFFFFF">ISSS608 Visual Analytics and Applications - Project <br><br> EXPLORING AND VISUALIZING SPATIO-TEMPORAL PATTERNS OF SELF-INFLICTED DEATHS IN INDIA FROM 2001-2012 USING R<br></font> |
</div> | </div> | ||
<!--MAIN HEADER --> | <!--MAIN HEADER --> | ||
{|style="background-color:#2b8474;" width="100%" cellspacing="0" cellpadding="0" valign="top" border="0" | | {|style="background-color:#2b8474;" width="100%" cellspacing="0" cellpadding="0" valign="top" border="0" | | ||
| − | | style="font-family:Century Gothic; font-size:100%; solid #000000; background:# | + | | style="font-family:Century Gothic; font-size:100%; solid #000000; background:#2c9985; text-align:center;" width="20%" | |
[[Group 4| <font color="#FFFFFF">Home</font>]] | [[Group 4| <font color="#FFFFFF">Home</font>]] | ||
| Line 18: | Line 18: | ||
[[Group 4 - Poster| <font color="#FFFFFF">Poster</font>]] | [[Group 4 - Poster| <font color="#FFFFFF">Poster</font>]] | ||
| − | | style="font-family:Century Gothic; font-size:100%; solid #000000; background:# | + | | style="font-family:Century Gothic; font-size:100%; solid #000000; background:#186658; text-align:center;" width="20%" | |
[[Group 4 - Application| <font color="#FFFFFF">R Shiny Application</font>]] | [[Group 4 - Application| <font color="#FFFFFF">R Shiny Application</font>]] | ||
| Line 29: | Line 29: | ||
The app is built for the NGOs, or government agencies working for the development of the society. Using this application, they can find the areas where the suicide rate is high and hence can formulate the awareness campaigns to educate the people to prevent suicides.<br /> | The app is built for the NGOs, or government agencies working for the development of the society. Using this application, they can find the areas where the suicide rate is high and hence can formulate the awareness campaigns to educate the people to prevent suicides.<br /> | ||
| − | The “'''''Overview'''''” page of the application will provide the overall suicide rate in India for all States and Union Territories. Also, one can view the suicide rate for different age group for selected states. For this the user can use select state from drop down and view the trend. All this can be observed over year range from 2001 – 2012 using slider.<br /> | + | The “'''''Overview'''''” page of the application will provide the overall suicide rate in India for all States and Union Territories. Also, one can view the suicide rate for different age group for selected states. For this the user can use select state from the drop down and view the trend. All this can be observed over year range from 2001 – 2012 using slider.<br /> |
| − | |||
| − | The “'''''Temporal Pattern'''''” page provides the time based trend in suicide rate for different age group for selected state (Select state from drop down). This will help the user to know the target age group so that they can formulate the program accordingly. Also, they need to know which are the main factors affecting it. So they can select the measures and view the pattern from the bar graph for particular age group (Select age group from drop down).<br /> | + | [[Image:G4dash1.jpeg|850px|center]] |
| + | [[Image:G4dash2.jpeg|850px|center]] | ||
| + | |||
| + | The “'''''Temporal Pattern'''''” page provides the time-based trend in the suicide rate for different age group for selected state (Select state from drop down). This will help the user to know the target age group so that they can formulate the program accordingly. Also, they need to know which are the main factors affecting it. So they can select the measures and view the pattern from the bar graph for particular age group (Select age group from drop down).<br /> | ||
[[Image:G4app2.JPG|850px|center]] | [[Image:G4app2.JPG|850px|center]] | ||
The “'''''Spatial Pattern'''''” page provides the spatial information about the different causes for different regions in India. Also, the correlation between male and female suicide rate can be seen from the bubble chart for different states.<br /> | The “'''''Spatial Pattern'''''” page provides the spatial information about the different causes for different regions in India. Also, the correlation between male and female suicide rate can be seen from the bubble chart for different states.<br /> | ||
| − | [[Image: | + | |
| + | [[Image:G4dash3.jpeg|850px|center]] | ||
Latest revision as of 09:34, 7 August 2017
ISSS608 Visual Analytics and Applications - Project
EXPLORING AND VISUALIZING SPATIO-TEMPORAL PATTERNS OF SELF-INFLICTED DEATHS IN INDIA FROM 2001-2012 USING R
My Shiny App
The app is built for the NGOs, or government agencies working for the development of the society. Using this application, they can find the areas where the suicide rate is high and hence can formulate the awareness campaigns to educate the people to prevent suicides.
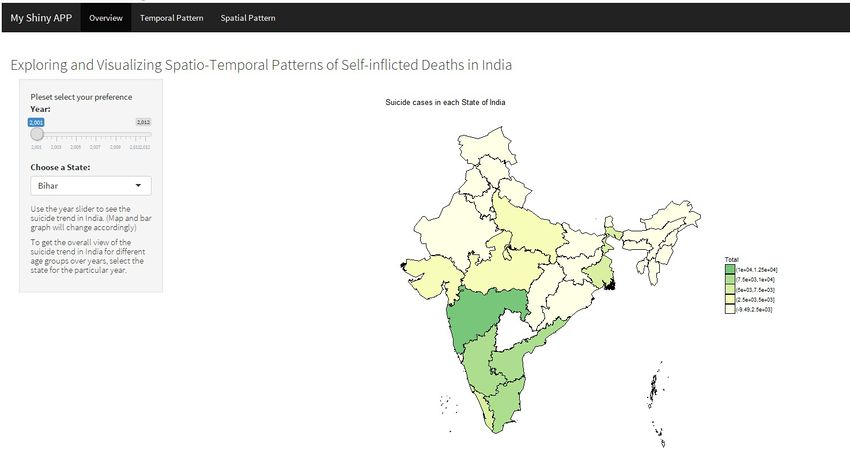
The “Overview” page of the application will provide the overall suicide rate in India for all States and Union Territories. Also, one can view the suicide rate for different age group for selected states. For this the user can use select state from the drop down and view the trend. All this can be observed over year range from 2001 – 2012 using slider.
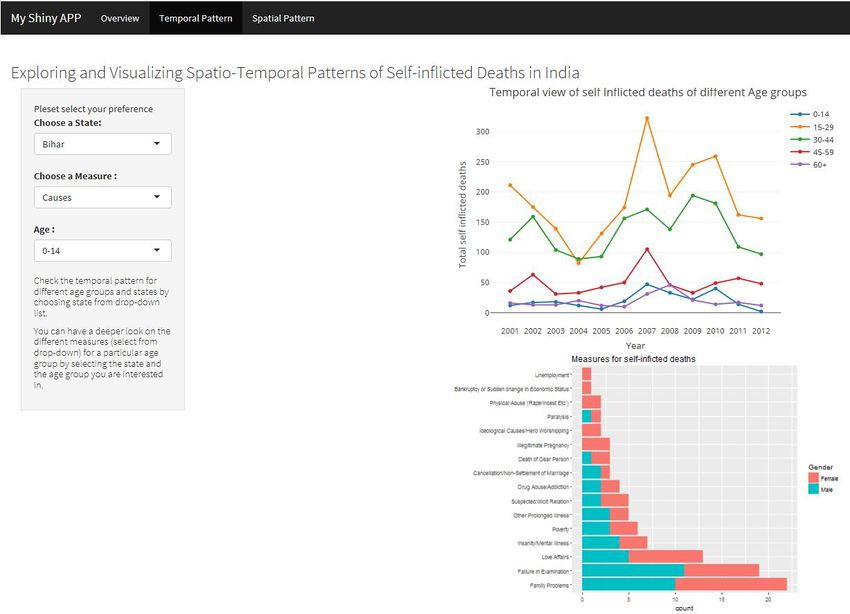
The “Temporal Pattern” page provides the time-based trend in the suicide rate for different age group for selected state (Select state from drop down). This will help the user to know the target age group so that they can formulate the program accordingly. Also, they need to know which are the main factors affecting it. So they can select the measures and view the pattern from the bar graph for particular age group (Select age group from drop down).
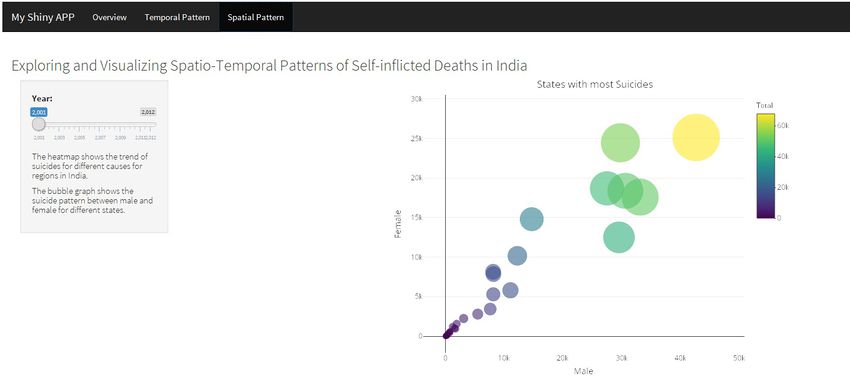
The “Spatial Pattern” page provides the spatial information about the different causes for different regions in India. Also, the correlation between male and female suicide rate can be seen from the bubble chart for different states.


