Difference between revisions of "ISSS608 2016 17T3 Group12 Report"
Jump to navigation
Jump to search
| Line 37: | Line 37: | ||
==Data Preparation== | ==Data Preparation== | ||
| − | |||
| − | |||
| − | |||
| − | |||
| − | |||
| − | |||
| − | |||
| − | |||
| − | |||
| − | |||
| − | |||
| − | |||
| − | |||
| − | |||
| − | |||
| − | |||
| − | |||
| − | |||
| − | |||
| − | |||
| − | |||
| − | |||
| − | |||
==Geospatial Interpolation== | ==Geospatial Interpolation== | ||
Revision as of 23:27, 6 August 2017
|
|
|
|
|
Contents
Application
The RainyApp can be accessed through:
insert link here.
Methodology
Data Preparation
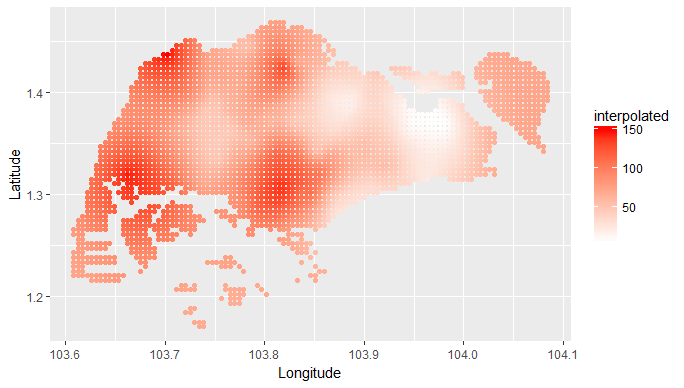
Geospatial Interpolation
| Description | R Script | Output | |
|---|---|---|---|
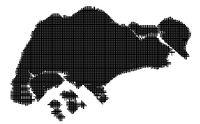
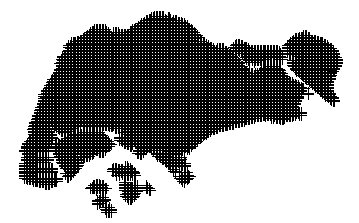
| Load the Shapefile and use it to create the map with a grid | |||
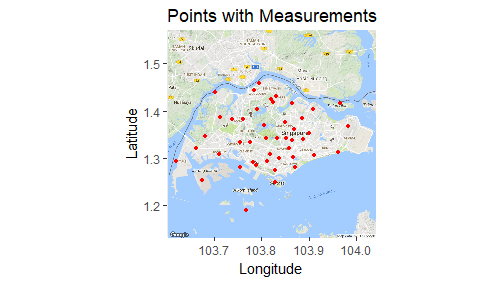
| Load the coordinates of each weather station and project it to the map | |||
| Filter the rainfall data based on the filter timeframe | |||
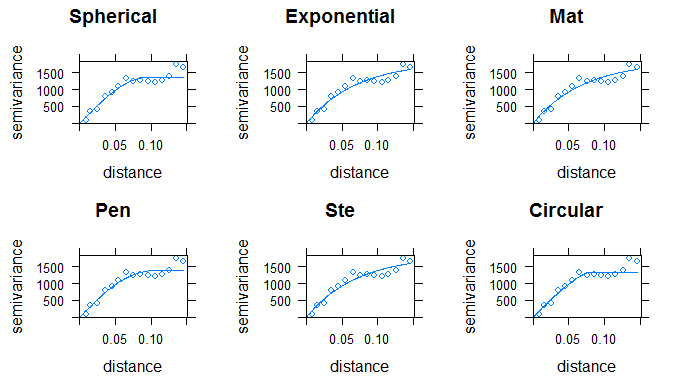
| Run the fit model for the variogram | |||
| Perform the Kriging based on the best fit variogram | |||
| Plot the interpolated values to the SG map |
Shiny Application
| Description | R Script | Output |
|---|---|---|
| row 1, cell 1 | row 1, cell 2 | row 1, cell 3 |
| row 2, cell 1 | row 2, cell 2 | row 2, cell 3 |
