Difference between revisions of "S-MALL Application"
Jump to navigation
Jump to search
| Line 29: | Line 29: | ||
== APPLICATION OVERVIEW == | == APPLICATION OVERVIEW == | ||
| + | <table width=100%> | ||
| + | <tr> | ||
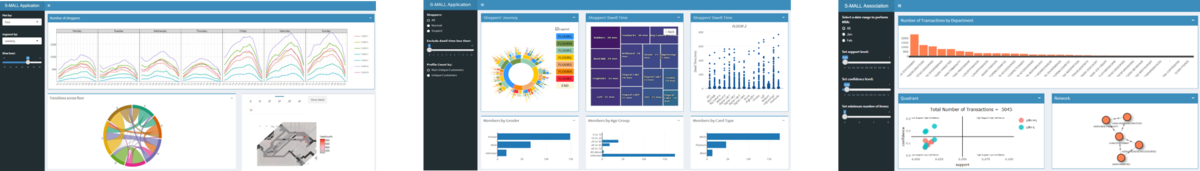
| + | <td align="center"><b>Movement Analysis</b></td> | ||
| + | <td align="center"><b>Member Analysis</b></td> | ||
| + | <td align="center"><b>Association Analysis</b></td> | ||
| + | </tr> | ||
| + | </table> | ||
| + | [[File:T3 Appoverview.png|center|1200px]] | ||
== APPLICATION DESCRIPTION == | == APPLICATION DESCRIPTION == | ||
Revision as of 12:05, 4 August 2017
Turning Concrete Malls into Smart Malls (S-MALL):
A web-based analytics application for visualizing and mapping in-mall customer journeys and shopping behaviours
Team S-MALL: Chen Yun-Chen | Chiam Zhan Peng | Zheng Bijun
|
|
|
|
|
|
APPLICATION OVERVIEW
| Movement Analysis | Member Analysis | Association Analysis |

APPLICATION DESCRIPTION
Part1:
| Visualization | Methodology & Technique | Usage |
|---|---|---|
| insert image of line chart |
|
|
| insert image of chord diagram |
|
|
| insert image of hexbin map |
|
|
Part2:
| Visualization | Methodology & Technique | Usage |
|---|---|---|
| insert image of sunburst |
|
|
| insert image of treemap |
|
|
| insert image of boxploter |
|
|
| insert image of bar chart |
|
|
Part3:
| Visualization | Methodology & Technique | Usage |
|---|---|---|
| insert image of bar |
|
|
| insert image of quadrant |
|
|
| insert image of network |
|
|