Difference between revisions of "Lw-questions"
| (4 intermediate revisions by the same user not shown) | |||
| Line 23: | Line 23: | ||
== Overall Findings == | == Overall Findings == | ||
| + | * Monitors | ||
| + | # Monitors all showed some record gaps across the working hours. | ||
| + | # Monitors 3-9 had correspondingly missing/redundant records for chemicals AGOC-3A and Methylosmolene. | ||
| + | # Monitors 1, 2, 7, 8 had several instant reading spikes that are seemed to be anomalous. | ||
| + | * Chemicals | ||
| + | # Chemical Appluimonia and Chlorodinine are in the trend of growing from April to December. | ||
| + | # Chemical AGOC-3A is likely to be released from 6am to 9pm everyday, while chemical Methylosmolene might be released during the late night 10pm to 5am. | ||
| + | * Factories | ||
| + | # Radiance ColourTek and Kasios Office Furniture are suspicous in releasing AGOC-3A. | ||
| + | # Roadrunner Fitness Electronics is responsible for releasing Chlorodinine. | ||
| + | # Indigo Sol Boards is likely to be the one releases Appluimonia. | ||
| + | <br> | ||
== Interactive Report == | == Interactive Report == | ||
| + | '''Please visit [https://public.tableau.com/shared/8S5239JW2?:display_count=yes Tableau Public Page of HUANG Liwei] to check the interactive dashboard.''' | ||
| + | <br> | ||
== Questions and Answers == | == Questions and Answers == | ||
=== Question 1 === | === Question 1 === | ||
| Line 35: | Line 49: | ||
Theoretically, each sensor should have reading records in every hour within the monitored month, if we group the records by the hour of day, the count of records in each hour should be the same as the number of days in that month. For example, there are 30 days in April, the count of records by hour of day in April should be 30 as well.<br> | Theoretically, each sensor should have reading records in every hour within the monitored month, if we group the records by the hour of day, the count of records in each hour should be the same as the number of days in that month. For example, there are 30 days in April, the count of records by hour of day in April should be 30 as well.<br> | ||
In the graph below, we set 30 as the benchmark of record count, if the count is less than 30, there will be represent as a dipped red bar; if the count is more than 30, there will be a spiked green bar instead.<br> | In the graph below, we set 30 as the benchmark of record count, if the count is less than 30, there will be represent as a dipped red bar; if the count is more than 30, there will be a spiked green bar instead.<br> | ||
| − | The finding is that for chemical AGOC-3A and Methylosmolene, sensors 3-9 all show some inversion change of counts, which means in some time points, the sensor would likley have additional readings for AGOC-3A and corresponding reading outages for Methylosmolene, which also proves that the sensor may have some issues during the operation such as confounding the chemicals occasionally.<br> | + | The finding is that for chemical AGOC-3A and Methylosmolene, sensors 3-9 all show some inversion change of counts, which means in some time points, the sensor would likley have additional readings for AGOC-3A and corresponding reading outages for Methylosmolene, which also proves that the sensor may have some issues during the operation such as confounding the chemicals occasionally.<ref><small>Thanks Ngo Siew Hui for her initiative inlightenment on the findings and creations on this graph.</small></ref><br> |
[[File:Lw-Trellis-Count.png|center]] | [[File:Lw-Trellis-Count.png|center]] | ||
| + | <references /> | ||
* '''Anomalous Reading Spikes''' | * '''Anomalous Reading Spikes''' | ||
There are also some instant spikes existing in reading records that are likely abnormal operation of the sensors. In the graph below, sensor 2 showed relatively small scale of readings across April 2016 except 17th 3am. Since we believe that the chemical generation from factory would likely last for a while, it is reasonable that such reading could be a false message.<br> | There are also some instant spikes existing in reading records that are likely abnormal operation of the sensors. In the graph below, sensor 2 showed relatively small scale of readings across April 2016 except 17th 3am. Since we believe that the chemical generation from factory would likely last for a while, it is reasonable that such reading could be a false message.<br> | ||
| Line 45: | Line 60: | ||
<br><br> | <br><br> | ||
<p align='justify'> | <p align='justify'> | ||
| − | * '''Monthly | + | * '''Monthly pattern''' |
Some of the chemicals may have a significant increasing in releases as the daily average readings through the days have formed a obvious gradiant from April to December. The two graphs below indicate that the releases of chemical Appluimonia and Chlorodinine are in the trend of growing from April to December.<br> | Some of the chemicals may have a significant increasing in releases as the daily average readings through the days have formed a obvious gradiant from April to December. The two graphs below indicate that the releases of chemical Appluimonia and Chlorodinine are in the trend of growing from April to December.<br> | ||
| − | <center>[[File:Calendar-Days1.png|500px]][[File:Calendar-Days2.png|500px]]</center> | + | <center>[[File:Calendar-Days1.png|500px]] [[File:Calendar-Days2.png|500px]]</center> |
| − | * '''Daily | + | * '''Daily pattern''' |
| − | The releases of chemicals may also have some patterns in a day. The graphs use the monthly average readings of each chemical as benchmark, then present the percentage of deviation from the benchmark in every hour of the day (average readings). It is evident that chemical AGOC-3A is likely to be released from 6am to 9pm everyday as the readings are much higher beyond the average in that period, on the contrary, chemical Methylosmolene might be released during the late night 10pm to 5am. | + | The releases of chemicals may also have some patterns in a day. The graphs use the monthly average readings of each chemical as benchmark, then present the percentage of deviation from the benchmark in every hour of the day (average readings). It is evident that chemical AGOC-3A is likely to be released from 6am to 9pm everyday as the readings are much higher beyond the average in that period, on the contrary, chemical Methylosmolene might be released during the late night 10pm to 5am.<br> |
| − | <center>[[File:Lw-Calendar-Hours.png|500px]] | + | <center>[[File:Lw-Calendar-Hours.png|500px]] [[File:Lw-Calendar-Hours2.png|500px]]</center> |
</p><br> | </p><br> | ||
=== Question 3 === | === Question 3 === | ||
'''Which factories are responsible for which chemical releases? Carefully describe how you determined this using all the data you have available. For the factories you identified, describe any observed patterns of operation revealed in the data. Limit your response to no more than 8 images and 1000 words.''' | '''Which factories are responsible for which chemical releases? Carefully describe how you determined this using all the data you have available. For the factories you identified, describe any observed patterns of operation revealed in the data. Limit your response to no more than 8 images and 1000 words.''' | ||
<br><br> | <br><br> | ||
| − | <center>[[File:Lw-Map.png|500px]][[File:Lw-Map2.png|500px]]</center | + | <p align='justify'> |
| − | + | These two map graphs show the locations of all monitors and factories.<br> | |
| − | + | <center>[[File:Lw-Map.png|500px]] [[File:Lw-Map2.png|500px]]</center> | |
| − | + | The wind speed fluctuates though the hours. As the severe wind would impact the accuracy of the sensor, the days and hours with the mild wind would likely provide relatively convincible readings. As for instance, 5th to 8th of December would be appropriate for detecting the chemical release with sensor readings.<br> | |
| − | + | [[File:Lw-Horizontal-Wind.png|center|500px]] | |
| − | The wind speed fluctuates though the hours. As the severe wind would impact the accuracy of the sensor, the days and hours with the mild wind would likely provide relatively convincible readings. As for instance, | + | With a line chart focusing on the targeted period, we may have a close look of the sensor readings. It is staightforward to detect the group spikes of chemical AGOC-3A among monitors 9 in 11th December. Our next step is to find out which factory may be the main reason that causes the spikes with the reference of wind direction.<br> |
| − | < | + | [[File:Lw-Line-Monitors.png|center|1000px]] |
| − | + | As we see from the wind stick graph below, in 11th December, the wind was blowing from the southwest mildly. Therefore, the chemical detected could likely be the factory to the southeast of the monitor 9, which are Radiance ColourTek and Kasios Office Furniture. | |
| − | + | [[File:Lw-Wind Stick.png|center|1000px]] | |
| − | With a line chart focusing on the targeted period, we may have a close look of the sensor readings. It is staightforward to detect the group spikes of chemical AGOC-3A among monitors | + | Since monitor 6 is located in the center of four factories, its readings are more sensitive to the wind direction. So if we take a deeper look at readings of monitor 6, we would find some high readings in 4th April for chemical Chlorodinine and 15th April for chemical AGOC-3A respectively. |
| − | < | + | [[File:Lw-Line-Monitor6.png|center|500px]] |
| − | + | As on 4th April, the wind was blowing from the northwest at those hours, we can conclude that Roadrunner Fitness Electronics is responsible for releasing Chlorodinine. On 15th April, the wind was blowing from northeast, hence the AGOC-3A detected is likely from Radiance ColourTek. | |
| − | + | [[File:Lw-Wind Stick2.png|center|1000px]] | |
Latest revision as of 23:31, 16 July 2017
Presented by: HUANG Liwei (liwei.huang.2016@mitb.smu.edu.sg)
Visualization tool: Tableau
Contents
Overall Findings
- Monitors
- Monitors all showed some record gaps across the working hours.
- Monitors 3-9 had correspondingly missing/redundant records for chemicals AGOC-3A and Methylosmolene.
- Monitors 1, 2, 7, 8 had several instant reading spikes that are seemed to be anomalous.
- Chemicals
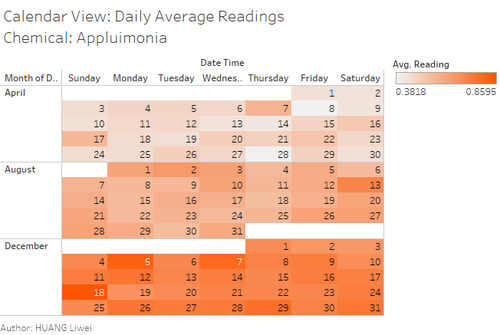
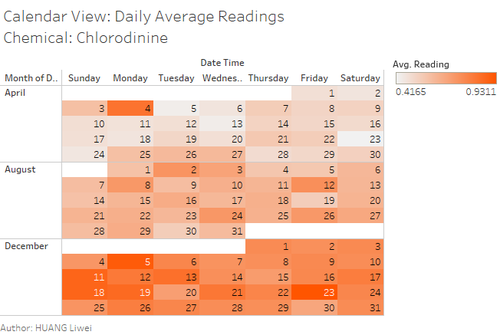
- Chemical Appluimonia and Chlorodinine are in the trend of growing from April to December.
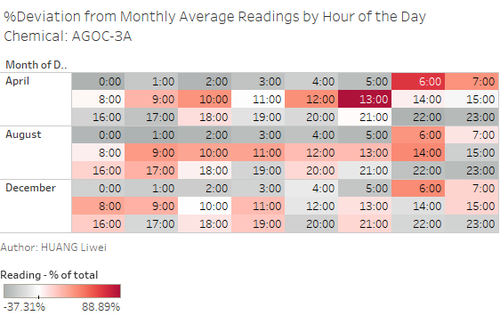
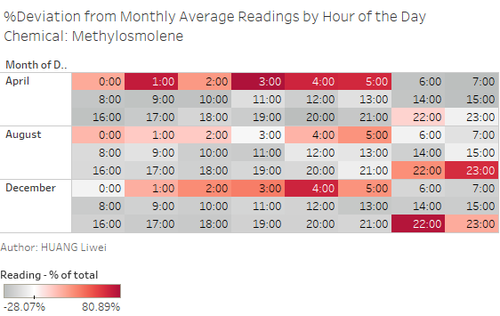
- Chemical AGOC-3A is likely to be released from 6am to 9pm everyday, while chemical Methylosmolene might be released during the late night 10pm to 5am.
- Factories
- Radiance ColourTek and Kasios Office Furniture are suspicous in releasing AGOC-3A.
- Roadrunner Fitness Electronics is responsible for releasing Chlorodinine.
- Indigo Sol Boards is likely to be the one releases Appluimonia.
Interactive Report
Please visit Tableau Public Page of HUANG Liwei to check the interactive dashboard.
Questions and Answers
Question 1
Characterize the sensors’ performance and operation. Are they all working properly at all times? Can you detect any unexpected behaviors of the sensors through analyzing the readings they capture? Limit your response to no more than 9 images and 1000 words.
- Record gaps
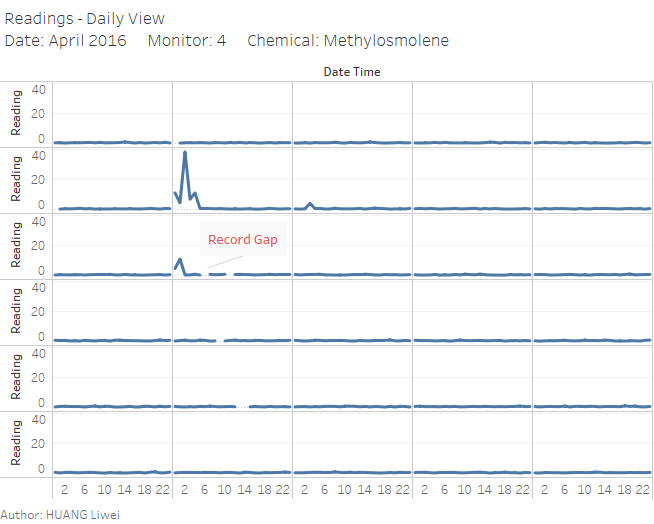
The sensors may not working properly at all times as there are some missing records for particular sensors/chemicals/time periods, which implies that there might be some issue happening during those time points. For instance, the graph below shows the daily reading records of monitor 4 for chemical Methylosmolene in April 2016, revealing several record gaps on day 12th ,17th and 22nd.
- Descrepant data counts
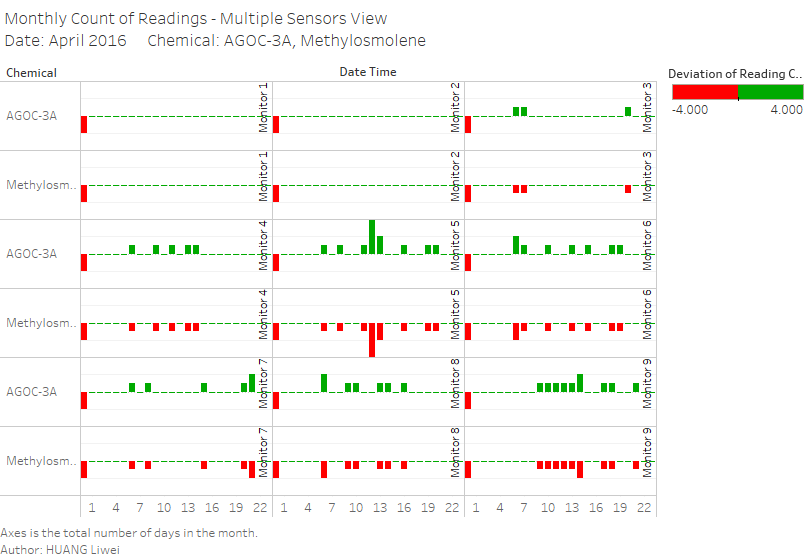
Theoretically, each sensor should have reading records in every hour within the monitored month, if we group the records by the hour of day, the count of records in each hour should be the same as the number of days in that month. For example, there are 30 days in April, the count of records by hour of day in April should be 30 as well.
In the graph below, we set 30 as the benchmark of record count, if the count is less than 30, there will be represent as a dipped red bar; if the count is more than 30, there will be a spiked green bar instead.
The finding is that for chemical AGOC-3A and Methylosmolene, sensors 3-9 all show some inversion change of counts, which means in some time points, the sensor would likley have additional readings for AGOC-3A and corresponding reading outages for Methylosmolene, which also proves that the sensor may have some issues during the operation such as confounding the chemicals occasionally.[1]
- ↑ Thanks Ngo Siew Hui for her initiative inlightenment on the findings and creations on this graph.
- Anomalous Reading Spikes
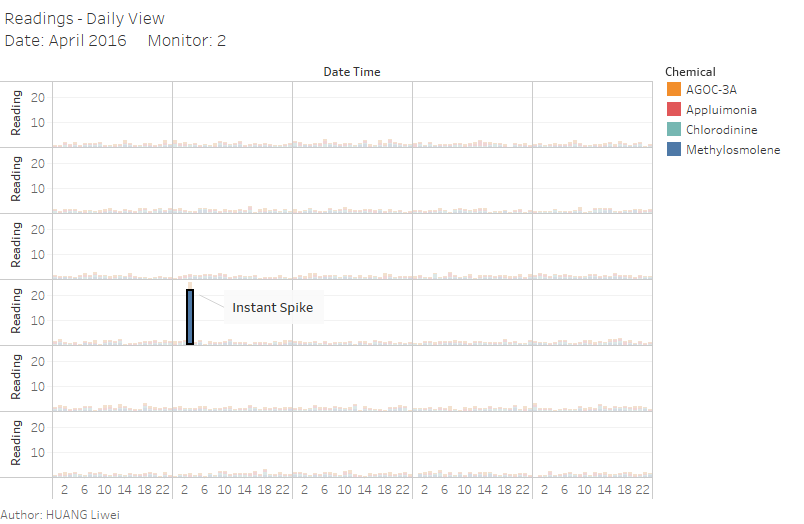
There are also some instant spikes existing in reading records that are likely abnormal operation of the sensors. In the graph below, sensor 2 showed relatively small scale of readings across April 2016 except 17th 3am. Since we believe that the chemical generation from factory would likely last for a while, it is reasonable that such reading could be a false message.
Question 2
Now turn your attention to the chemicals themselves. Which chemicals are being detected by the sensor group? What patterns of chemical releases do you see, as being reported in the data? Limit your response to no more than 6 images and 500 words.
- Monthly pattern
Some of the chemicals may have a significant increasing in releases as the daily average readings through the days have formed a obvious gradiant from April to December. The two graphs below indicate that the releases of chemical Appluimonia and Chlorodinine are in the trend of growing from April to December.
- Daily pattern
The releases of chemicals may also have some patterns in a day. The graphs use the monthly average readings of each chemical as benchmark, then present the percentage of deviation from the benchmark in every hour of the day (average readings). It is evident that chemical AGOC-3A is likely to be released from 6am to 9pm everyday as the readings are much higher beyond the average in that period, on the contrary, chemical Methylosmolene might be released during the late night 10pm to 5am.
Question 3
Which factories are responsible for which chemical releases? Carefully describe how you determined this using all the data you have available. For the factories you identified, describe any observed patterns of operation revealed in the data. Limit your response to no more than 8 images and 1000 words.
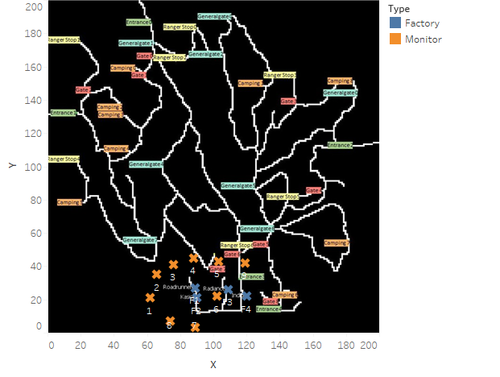
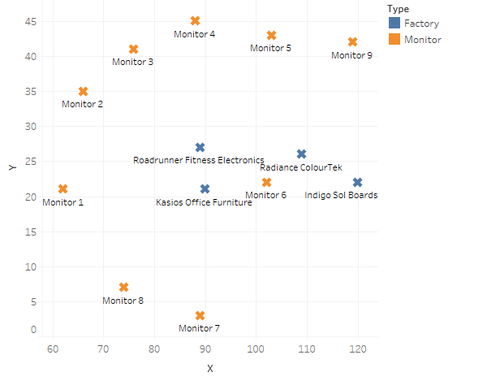
These two map graphs show the locations of all monitors and factories.
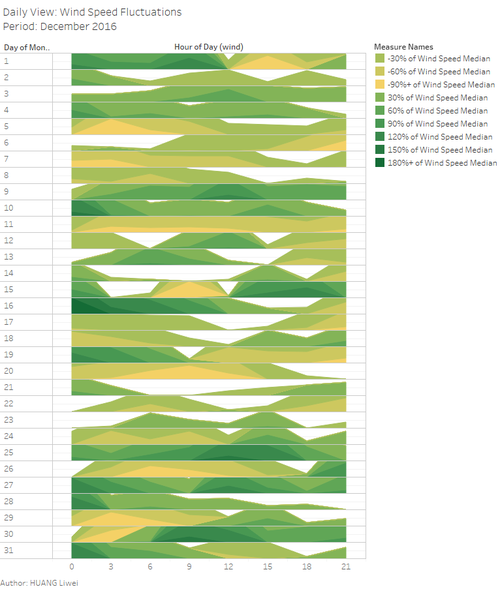
The wind speed fluctuates though the hours. As the severe wind would impact the accuracy of the sensor, the days and hours with the mild wind would likely provide relatively convincible readings. As for instance, 5th to 8th of December would be appropriate for detecting the chemical release with sensor readings.
With a line chart focusing on the targeted period, we may have a close look of the sensor readings. It is staightforward to detect the group spikes of chemical AGOC-3A among monitors 9 in 11th December. Our next step is to find out which factory may be the main reason that causes the spikes with the reference of wind direction.
As we see from the wind stick graph below, in 11th December, the wind was blowing from the southwest mildly. Therefore, the chemical detected could likely be the factory to the southeast of the monitor 9, which are Radiance ColourTek and Kasios Office Furniture.
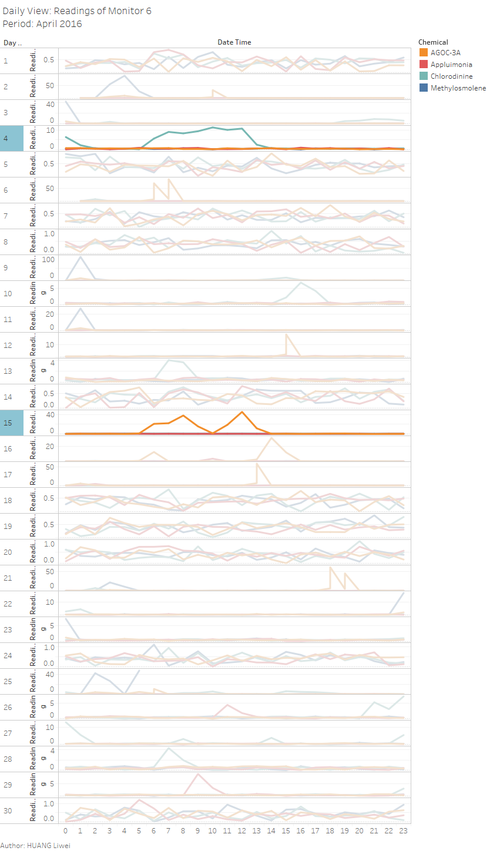
Since monitor 6 is located in the center of four factories, its readings are more sensitive to the wind direction. So if we take a deeper look at readings of monitor 6, we would find some high readings in 4th April for chemical Chlorodinine and 15th April for chemical AGOC-3A respectively.
As on 4th April, the wind was blowing from the northwest at those hours, we can conclude that Roadrunner Fitness Electronics is responsible for releasing Chlorodinine. On 15th April, the wind was blowing from northeast, hence the AGOC-3A detected is likely from Radiance ColourTek.

