Difference between revisions of "ISSS608 2016-17 T3 Assign AKANKSHA MITTAL - Dashboard"
| Line 50: | Line 50: | ||
== Solution for Question 2 == | == Solution for Question 2 == | ||
| − | From '''''figure | + | From '''''figure 6''''' above, we can see that car-type 1 and 2 i.e. 2 axle car/bike and trucks gather through general gate 1 and 2 and ranger-stop 0 and 2. This route General-gate 1 --> Ranger-stop 2 --> Ranger-stop 0 --> General-gate 2 or the other way round is used very frequently. |
== Solution for Question 3 == | == Solution for Question 3 == | ||
Revision as of 00:37, 7 July 2017
|
|
|
|
Contents
Data Exploration
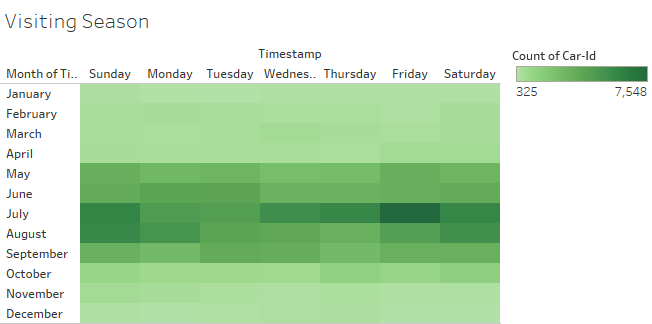
While exploring data, I found that the general visiting peak time is from May to September, out of which July was the most crowded.

Figure 1
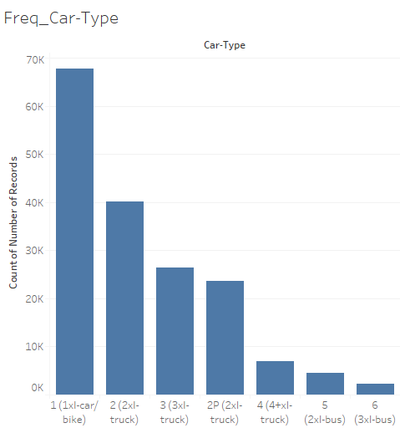
The car-type 1 is the most common vehicle that is part of preserve traffic.

Figure 2
The movement of vehicles are more prone from 6 am to 5 pm then the traffic starts decreasing.

Figure 3
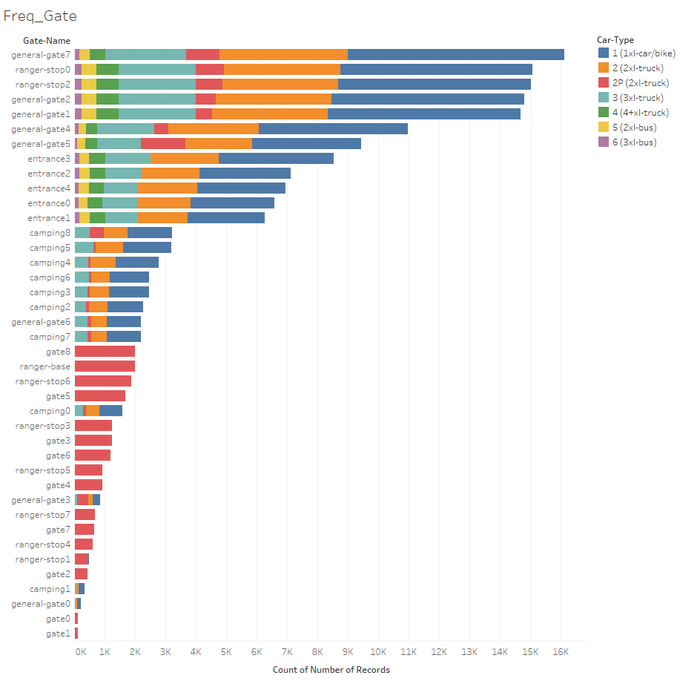
Frequency of vehicles passing through different gates.
Figure 4
Solution for Question 1
1. From figure 4 above, we can see that vehicles of car-type 2P, which seems ranger vehicles, are not present from 4 am to 5 am everyday throughout the year. This may be they have break at that time. Also when further investigated, it seems they have different off period on different days as shown by the below heatmap:
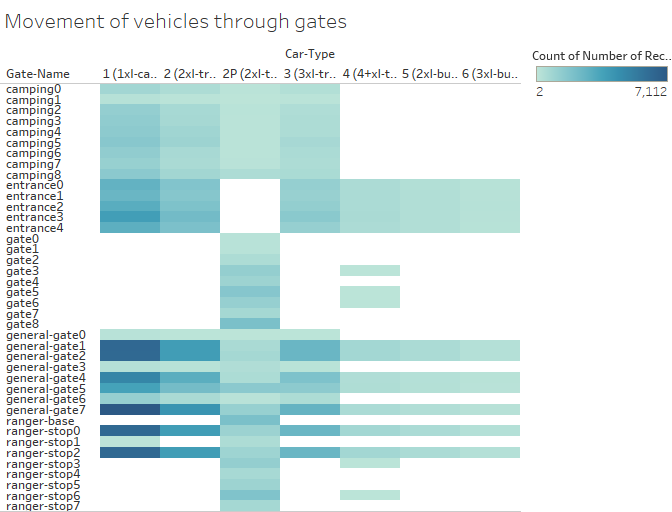
2. By looking to the below heatmap, it seems that car-type 5 and 6 i.e. 2 and 3 axle bus use the preserve just for passing through purpose as it never enters the restricted zone.

Figure 6
3. The above heatmap also shows that the car-type 4 i.e. 4 and above axle truck are not moving through camp sites, may be heavy vehicles are not allowed to enter those sites due to noise.
Solution for Question 2
From figure 6 above, we can see that car-type 1 and 2 i.e. 2 axle car/bike and trucks gather through general gate 1 and 2 and ranger-stop 0 and 2. This route General-gate 1 --> Ranger-stop 2 --> Ranger-stop 0 --> General-gate 2 or the other way round is used very frequently.
Solution for Question 3
From the heatmap in solution 1, I found that few vehicles are present at ranger-stop 1 which is only accessible through gate 2, but their movement is not captured by the guarding gate, which makes the situation suspicious. When i did further investigation i found that on Friday, July 10, 2015 6 car-type 1 were present at the ranger-stop 1 without being tracked by the gate 2 that prevents general traffic to pass through.


