Trenchcoat Detectives
ISSS608: Visual Analytics and Applications
- Anuthama Murugesan
- Krutika Balveer Choudhary
- Sumalika Kodumuru
|
|
|
|
|
|
Building Geospatial Analysis Application for Uncovering Patterns and Detecting Anomalies from Vehicle Movement Data
Abstract:
Geospatial analysis is a growing subject of interest owing to many reasons - but a clear driver is data availability and data accessibility. The rise of the sensors and IOT era has made data capture by independent organizations and bodies plausible and this improves accessibility to movement data which was earlier limited to usage by government bodies and leading researchers. But what is being done with all this data? We sought to create a reusable dashboard to aid in visualizing the vehicle movements and using easily interpretable plots.
Our study utilizes data from a Natural Preserve to explore vehicle movement patterns. The scope includes the analysis and visual representation of frequency related findings such as ‘peak and non-peak periods’ and route related findings such as ‘path navigation through the preserve’ with the aid of interactive dashboards.
Motivation:
Many aspects of Human behaviour is unpredictable and interesting to analyse. We feel a key indicator of behavior is movement.In our study we have used this movement data as a proxy to certain human patterns and behaviours that would aid business in strategic decision making. As the world moves towards an era of sensors and IOT, there are terabytes of data produced daily which would provide us with a plethora of data to work with.Below are some of the use cases where we feel this analysis would be useful:
- Frequently used in sales and marketing to leverage peak footfall and push sales during non-peak seasons.
- Governments can use this movement data for Transportation and traffic planning. New bus/MRT Routes can be introduced/ frequency of existing transportation can be increased during peak hours.
- Visualize and analyse patterns in crime locations. Crime cases can leverage on movement data by focusing on anomalies
- Strategic location determination in business.
Dataset Overview:
Our study utilizes data from a Natural Preserve to explore vehicle movement patterns.Data is recorded from sensors around the Boonsong Lekagul Nature PreserveData and is available as given below:
- TimeStamp:
Timestamp data from the movement of vehicles through the Preserve
- Car Types/Categories:
When vehicles enter the Preserve, they must proceed through a gate and obtain a pass. The gate categorizes vehicles as follows:
1. 2 axle car (or motorcycle)
2. 2 axle truck
3. 3 axle truck
4. 4 axle (and above) truck
5. 2 axle bus
6. 3 axle bus
- Gate Names:
1.Entrances: All vehicles pass through an Entrance when entering or leaving the Preserve.
2. General-gates: All vehicles may pass through these gates. These sensors provide valuable information for the Preserve Rangers trying to understand the flow of traffic through the Preserve.
3. Gates: These are gates that prevent general traffic from passing. Preserve Ranger vehicles have tags that allow them to pass through these gates to inspect or perform work on the roadway beyond.
4. Ranger-stops: These sensors represent working areas for the Rangers, so you will often see a Ranger-stop sensor at the end of a road managed by a Gate. Some Ranger-stops are in other locations however, so these sensors record all traffic passing by.
5. Camping: These sensors record visitors to the Preserve camping areas. Visitors pass by these entering and exiting a campground.
- Preserve Map:
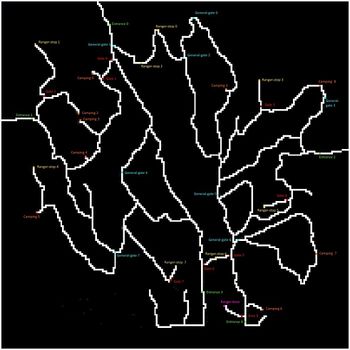
The contractors working with the Nature Preserve rangers have provided a map that presents the Preserve in terms of a 200x200 gridded area. The grid is oriented with north at the top of the map. Grid location (0,0) is at the lower left corner of the map (the SW corner). They have superimposed both the roadways and the sensor locations on this grid. The map shows an area 12 miles x 12 miles.
Roadways are indicated by white colored pixels on the map. Each sensor type has its own unique color: Entrances (green), General-gates (blue), Gates (red), Ranger-stops (yellow), and Camping (orange).
- Additional notes:
1. Traffic either passes through the Preserve, stay as day campers, or stay as extended campers.
2. Preserve Rangers stay at the ranger-base toward the southeast of the Preserve when they are not working in the Preserve.
3. The speed limit through the Preserve is 25 mph.
4. The Preserve area does not observe “Daylight Savings Time”.
5. The roadways traveling southward from Entrances 3 and 4 do continue to other roadways outside of the Preserve area, but these are not shown on the map. Vehicle data will not reflect travel beyond the Preserve in this direction.
- Data Table Snippet:
Project Scope
In order to make our app usable by a larger audience we have removed the car-type data. This data is very specific and may not be applicable to all use cases. Additionally our project scope covers frequency related findings and route related findings.
We have incorporated calendar heat maps to understand the peak and non-peak cycles across months, day of the weeks and hour of the day. This has enabled us to plot all the movement data over time on a single view. The patterns and trends identified can be used to drill down for further exploration. The route taken by the vehicles was explored using Sunburst diagrams. This has been used to view a summary of the paths taken and understand the more popular paths. Common destinations and starting points can be easily identified and compared.
Project Timeline:


