Mystery at the Wildlife Preserve
1. Introduction
The Indian Premier league was started in 2008. In May of each year the Indian Premier League schedules it's tournament of 20 over cricket matches which are played across all of the major cricket stadiums all across India.
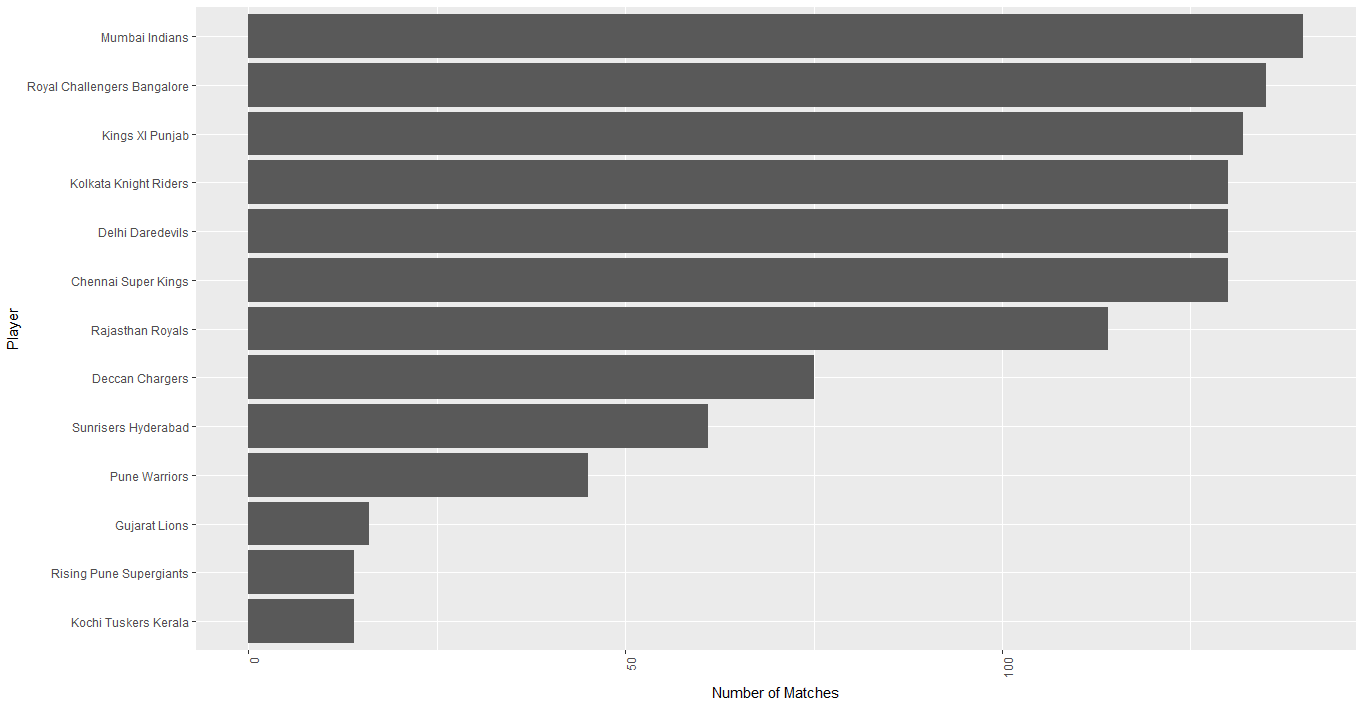
Format: There are 9 to 12 teams each year which are named after the tier one cities, as is show below:
The competitive tournament lasts for about 1 month. Players are auctioned months ahead for the 8 to 12 teams which would participate in the mega cricketing event of the year. The auction for the players is a crucial time for each team member and owner. Like most auctions the team owners must select the best member which fit their team. The auction for the widely-viewed event can cost team owners as much as $12-$25 million each year. The project delves into the statistics of the game which would be useful to team owners in season 10 and beyond before the auction. The owners and management would be able to understand the player’s comparative performance among other key stats.
2. Data Preparation
The project has been made in the R programming language.
R is the open source programming language for statistics and for software environment for statistical computing and graphics. It's supported by the R Foundation.
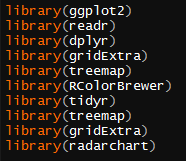
R's capabilities are extended with user-created packages. These allow some specialized, statistical techniques, some graphical devices, the import/export capabilities and even the reporting tools (such as knitr among others). The packages used in this project are as shown below.
Data Given:
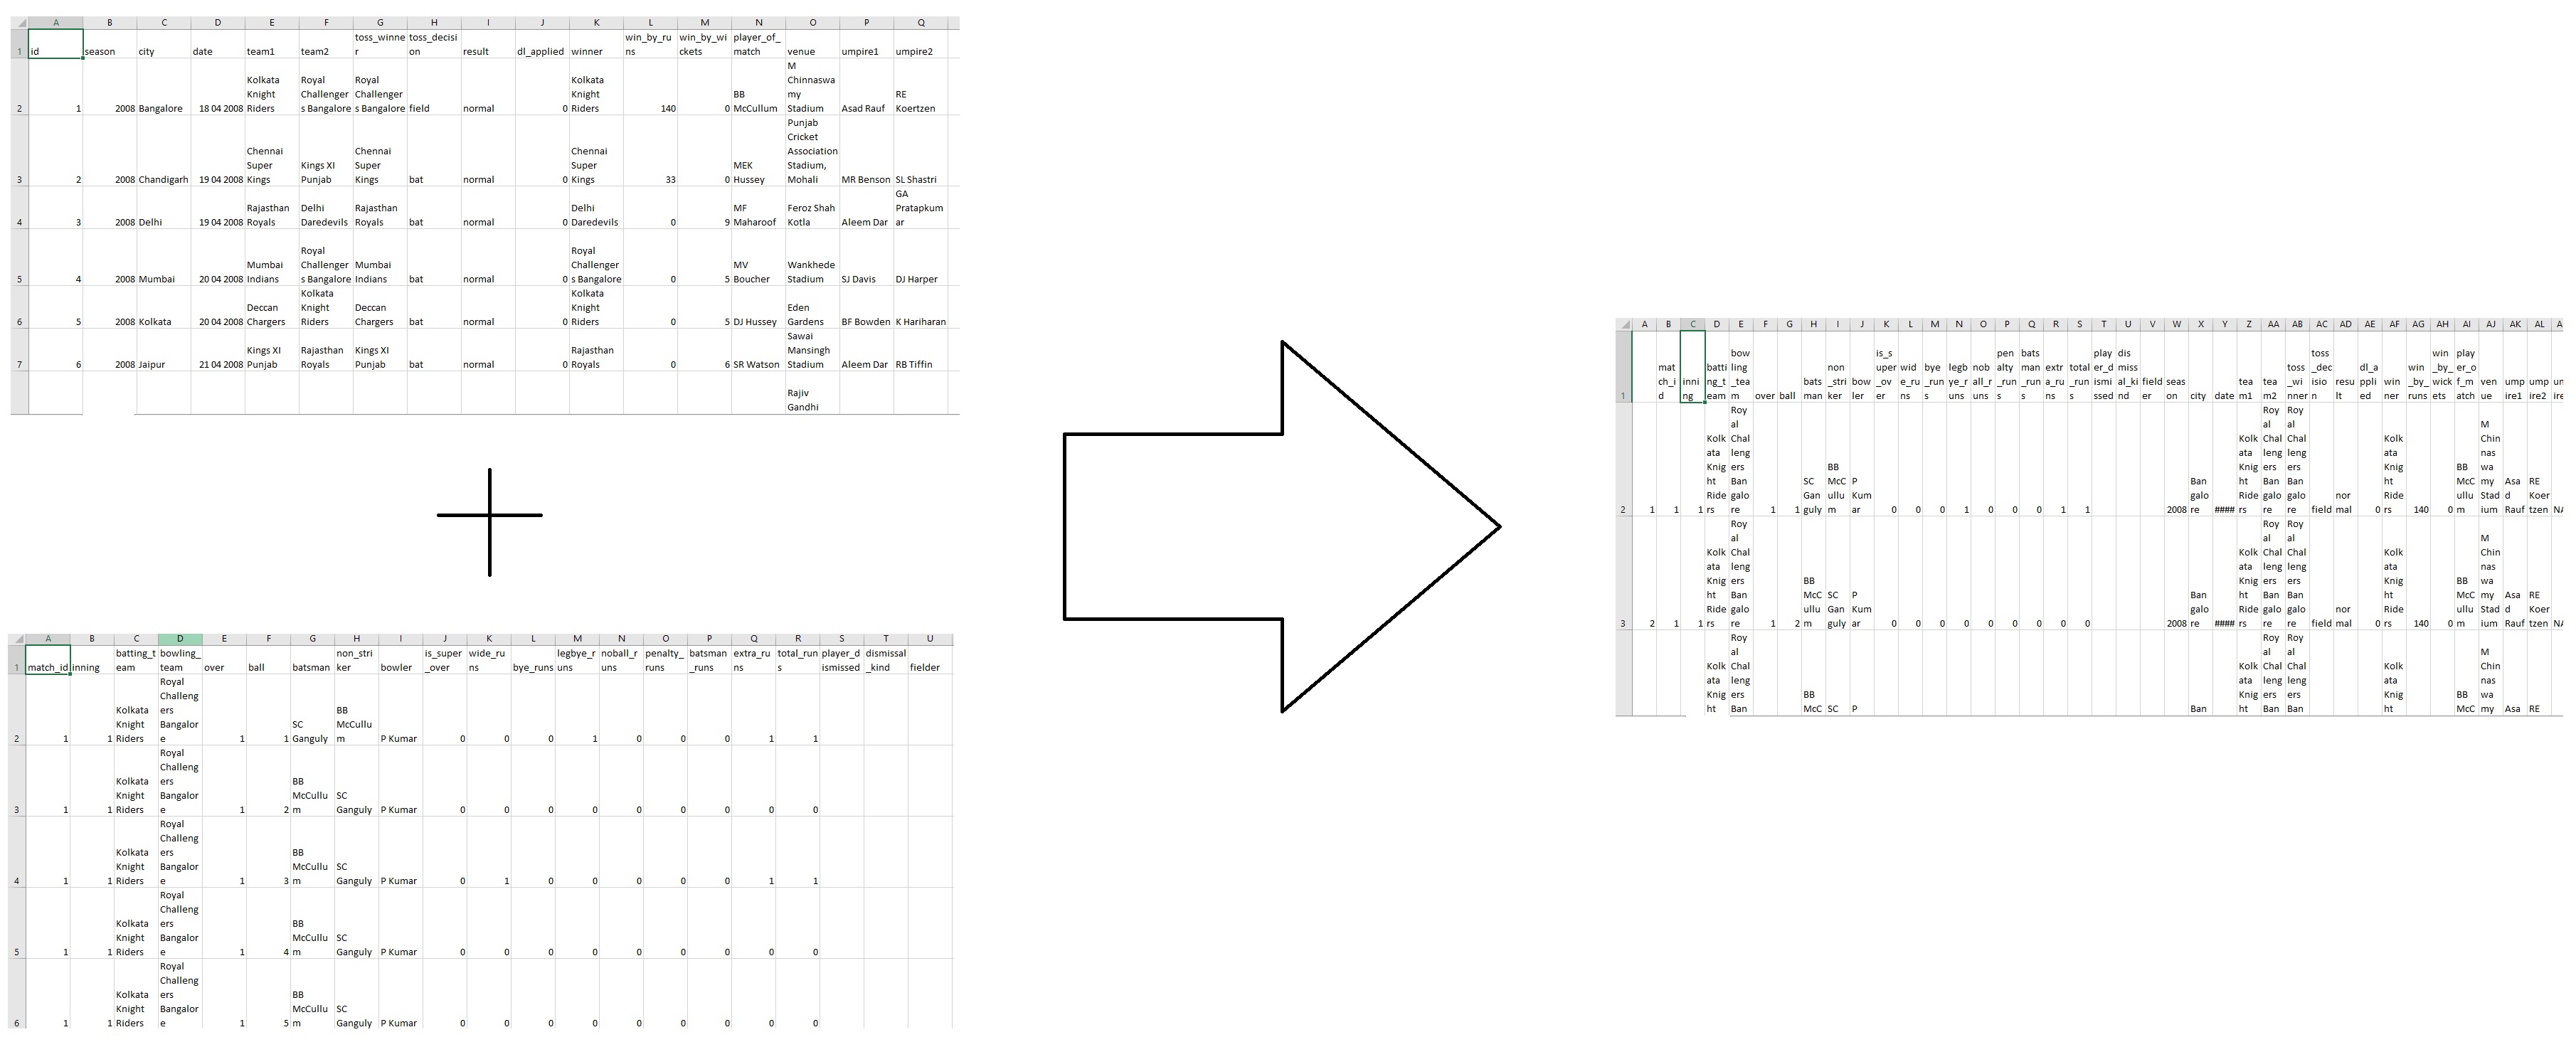
Matches data: (578 rows) id, season, city, date, team1&2, toss winner, toss_decision, result dl_applied, winner, win_by_runs, win_by_wickets, player_of_match, venue, umpire 1, 2 & 3
Deliveries data: (136599 rows) match_id, inning, batting_team, bowling_team, over, ball, batsman, non_striker, bowler, is_super_over, wide_runs, bye_runs, legbye_runs, noball_runs, penalty_runs, batsman_runs, extra_runs, total_runs, player_dismissed, dismissal_kind and fielder Data Preparation: The Matches data and the Deliveries data were filtered based on the normal result and combined by the match id. A new data set created which combined the ball by ball result of each match.
3. Model Building
The model was built in R using the following packages: ggplot2 (for data visualization), readr, plyr, dplyr, gridExtra, treemap, RColorBrewer, tidyr, radarchart The dplyr package was used for manipulating the large to long format, group_by and to manipulate other formats.
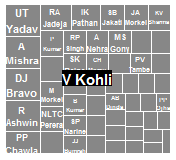
Implementation: The model was wrangled and plotted using ggplot. The Treemap was made using the package and depicts the runs a player made against bowlers in decreasing order. The legends were removed for ease of the viewer to read the data clearly among other things.
4. Methodology
Model Building: The model was built in R using the following packages: ggplot2 (for data visualization), readr, plyr, dplyr, gridExtra, treemap, RColorBrewer, tidyr, radarchart The dplyr package was used for manipulating the large to long format, group_by and to manipulate other formats.
Implementation: The model was wrangled and plotted using ggplot. The Treemap was made using the package and depicts the runs a player made against bowlers in decreasing order. The legends were removed for ease of the viewer to read the data clearly among other things.
5. Insights
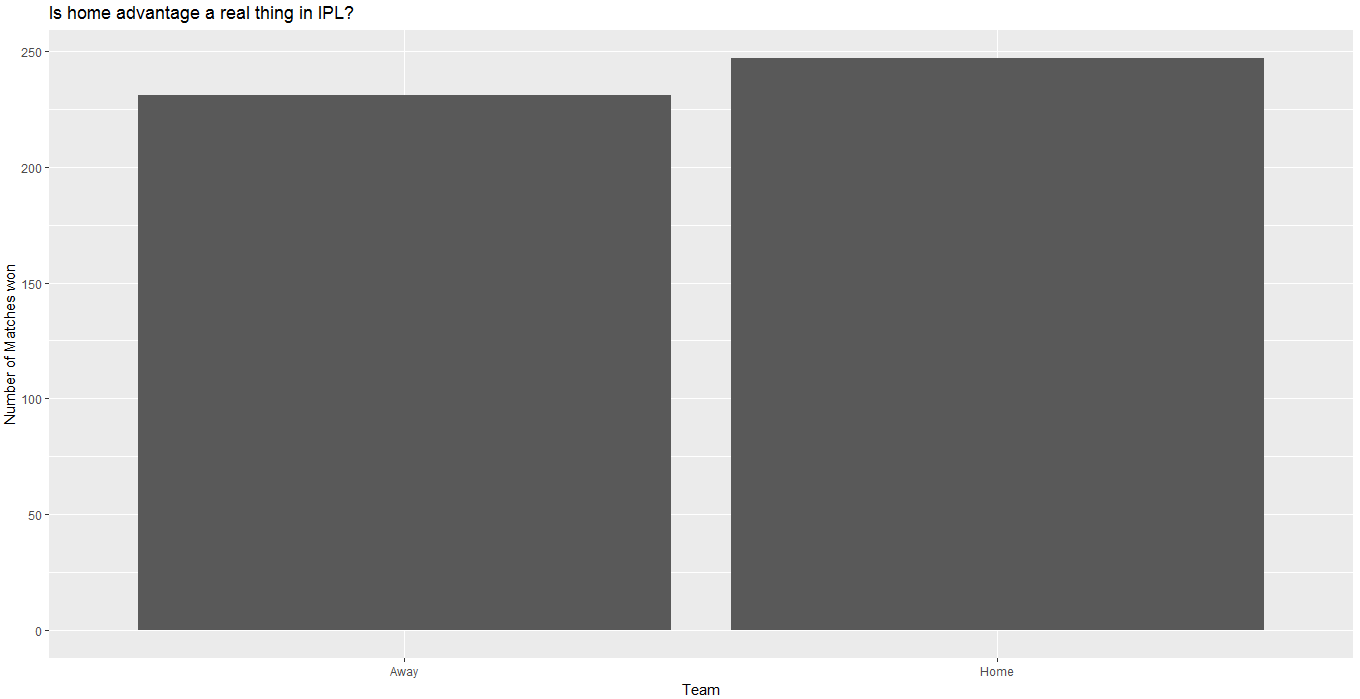
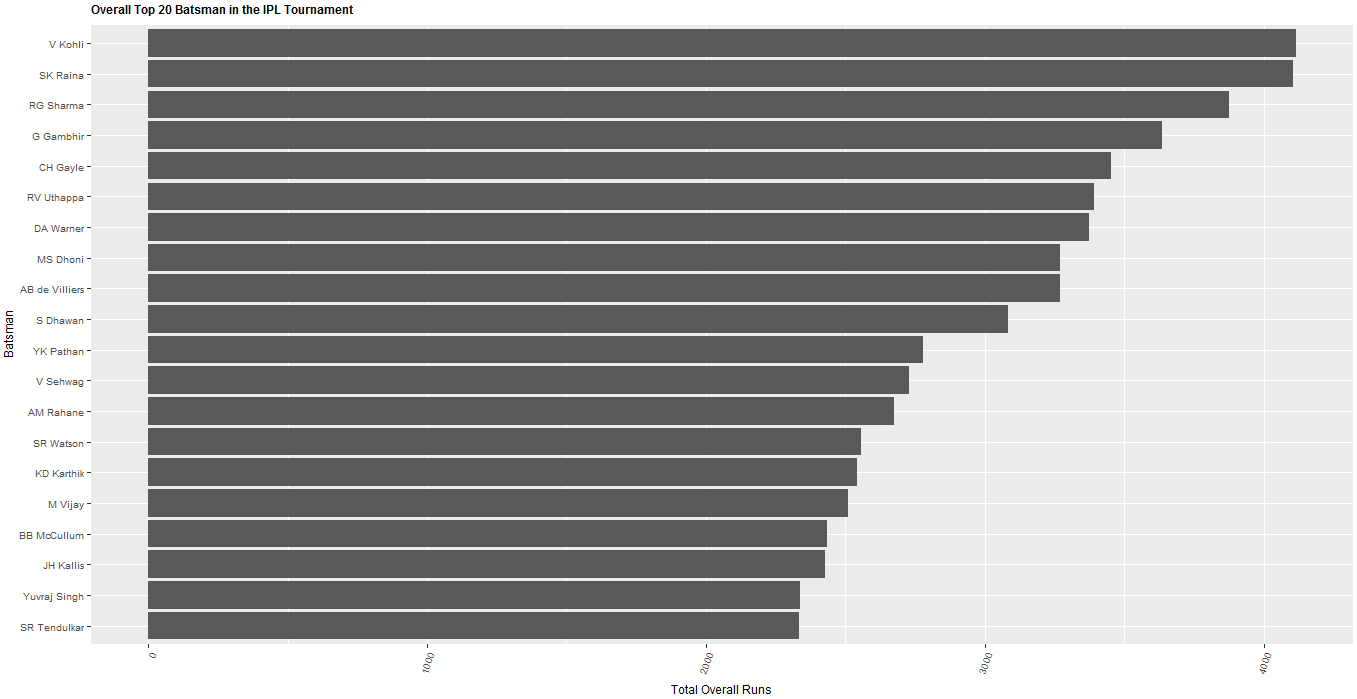
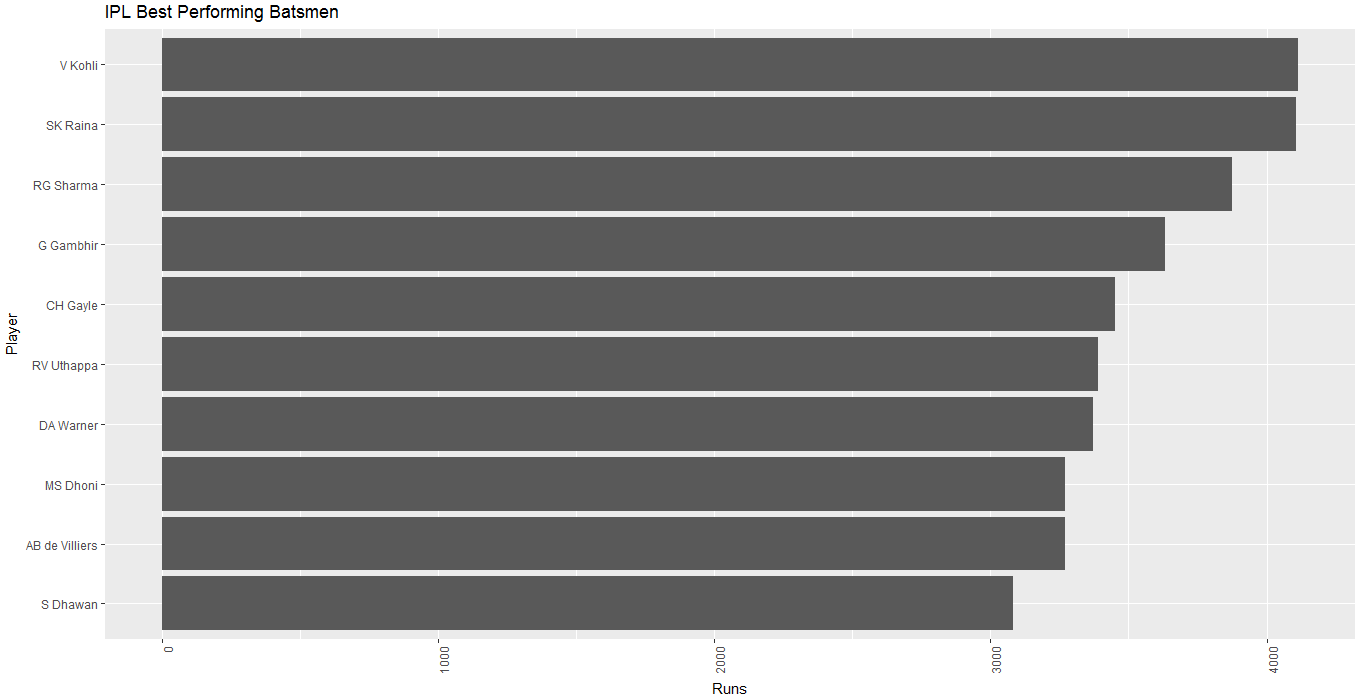
After preparing the data, ggplot2 was used to visualize the data based on the statistics needed. It was seen that Mumbai Indians played the most number of matches and did have a home advantage in winning matches. This was seen as there were more victories in the home ground of Mumbai. Batsmen set the target while combating bowlers. Virat Kohli was the best batsman and has scored against some of the best bowlers as shown in the tree-map. The information shown for the opponents of Delhi Daredevils would include the bowlers against whom Virat performed poorly. For the top four batsmen the strike rate was compared. The margin of the victories won by the bowling team first have been shown as well and clearly elucidates the performance of the performance of the 9 teams.
5. Conclusion
The information depicted is of 9 seasons of IPL and a clear trend can be seen for the match winning combination of team members and the batting strengths. The side with the better batsmen and the home support tend to win the match more often than the converse. The top batsmen have been consistent in their performance. Mumbai Indians have needed more games for each win while teams like CSK have needed less to win.
6. Future Works
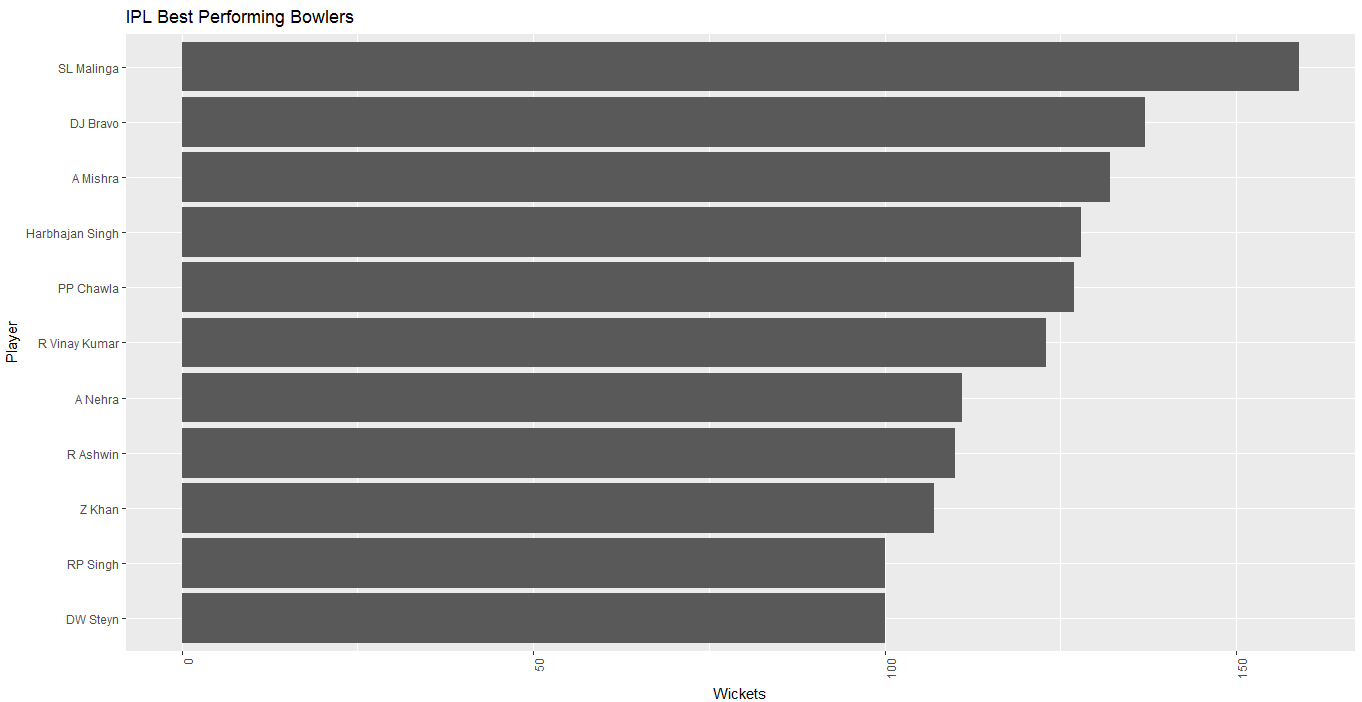
The model can be used to better assess the outcome of a match and predict the outcome based on a good bowling attack versus the batting attack which has been depicted here. Also tree-maps to compare bowlers can be pursued.
10. References

