ISSS608 Sanghavy Data Preparation
|
|
|
|
|
Contents
Background of given data
The given Lekagul sensor data is a .csv file contains 4 fields:
- Timestamp: the date and time the sensor reading was taken
- Car-id: the assigned car ID from the entry gate
- Car-type: Vehicle type as enumerated above. “P” is appended when it is a park vehicle.
- Gate-name: name of the sensors taking the reading. See the map.
Car type
There are 7 types of car including the park vehicle and 5 different sensors present at each Gate type.
- The dataset has the car type as integers 1, 2, 3, 4, 5, 6 and park vehicles as 2P
| Integers | Car type |
|---|---|
| 1 | 2 axle car (or motorcycle) |
| 2 | 2 axle truck |
| 3 | 3 axle truck |
| 4 | 4 axle (and above) truck |
| 5 | 2 axle bus |
| 6 | 3 axle bus |
| 2P | Park vehicle – 2 axle truck |
Gate types
| Gate Category | Gate Name |
|---|---|
| Camping | Camping0, Camping1, Camping2, Camping3, Camping4, Camping5, Camping6, Camping7, Camping8 |
| Entrance Gate | Entrance0, entrance1, entrance2, entrance3, entrance4 |
| General Gates | General-gate0, General-gate1, General-gate2, General-gate3, General-gate4, General-gate5, General-gate6, General-gate7 |
| Gate | Gate0, Gate1, Gate2, Gate3, Gate4, Gate5, Gate6, Gate7, Gate8 |
| Ranger Stops | Ranger-stop0, Ranger-stop1, Ranger-stop2, Ranger-stop3, Ranger-stop4, Ranger-stop5, Ranger-stop6, Ranger-stop7 |
| Ranger Base | ranger-base |
Data Preparation – Tableau
STEP 1: Creating Aliases for Car Type
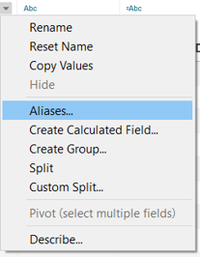
As mentioned in the background, the car type variable is represented as integers in the given .csv file. So, we create aliases for them to better understand and also for aesthetic purposes. After importing the file into Tableau, right-click on the triangle in Car type variable in the data source tab and click on Aliases:
STEP 2: Grouping gate name
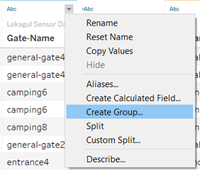
Secondly, the 40 gates available can be grouped into 5 types. As mentioned in Table 2, we can get 5 groups but we can separate Ranger base from ranger stops for better analysis and keep it as a separate variable. To do this, right-click on the triangle in Gate name variable in the data source tab:
STEP 3: CREATING X and Y COORDINATES FOR each sensor location
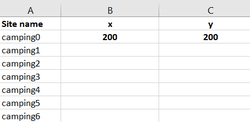
In this step, we create x and y coordinates for each sensor location. This is done by using the mapping feature in Tableau. First an excel file is created with the gate names and empty x and y columns with either null values or some sample values like shown below:
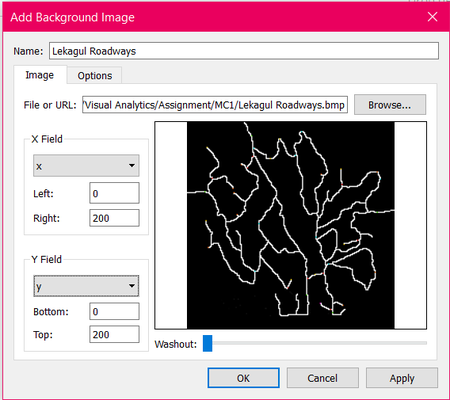
This excel file is imported into Tableau and Lekagul reserve image (of 200x200 dimension) is loaded as background image using Maps -> Background image option using the created x and y variables.
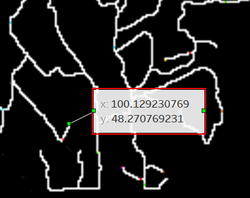
Now drag x and y into columns and rows respectively and remove the aggregate measures. Then x and y coordinates for each gate location is manually entered into the excel file by annotating the gate location with x and y coordinates. Annotation is done by selecting the gate location and right-click and use the Annotating point option as shown:
These values are manually entered into the excel file for each gate location.
STEP 4: IMPORTING THE COORDINATE FILE INTO TABLEAU
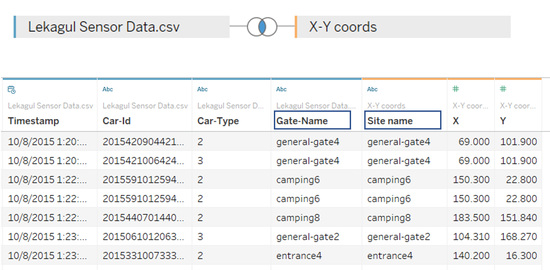
The Lekagul Sensor .csv file is loaded into Tableau and an inner join is made with above created excel file using Gate name(lekagul sensor data) and Site name(x-y cords) as the linking variable.

