ISSS608 2016-17 T3 Assign ZHENG BIJUN
Contents
VAST Challenge 2017: Mini-Challenge 1
Mistford is a mid-size city is located to the southwest of a large nature preserve. It has been discovered that the number of nesting pairs of the Rose-Crested Blue Pipit, a popular local bird due to its attractive plumage and pleasant songs, is decreasing! Provided several datasets, it is required to investigate the reason for the decrease of Rose-Crested Blue Pipit. In Mini-Challenge 1, traffic movement dataset is given to analyze patterns of life of vehicles through out the reserve, and detect unusual patterns that are potentially harmful to the birds. Questions raised are:
- Describe up to six daily patterns of life by vehicles traveling through and within the park.
- Describe up to six patterns of life that occur over multiple days (including across the entire data set) by vehicles traveling through and within the park.
- Describe up to six unusual patterns (either single day or multiple days) and highlight why you find them unusual.
- What are the top 3 patterns you discovered that you suspect could be most impactful to bird life in the nature preserve?
This webpage will guide you through my investigations and help to save Rose-Crested Blue Pipit!
Data Description
Entry gates are positioned at the Preserve entrances. Each vehicle receives an entry ticket at the gate and is assigned a vehicle class; the entry is recorded. The entry ticket contains an RF-tag that enables the Preserve sensors to pick up the passage of a vehicle through the Preserve. Each vehicle surrenders their entry ticket when exiting the Preserve and the exit is recorded. A .csv file containing data recorded from sensors around the Boonsong Lekagul Nature Preserve. A map containing the locations of roadways and sensors throughout the Preserve is also provided.
Dataset Overview
| 1 CSV Traffic Movement Data | 2 Roadway Map |
More Detailed Data Facts
1 CSV Traffic Movement Data
- Entrances:
- All vehicles pass through an Entrance when entering or leaving the Preserve.
- General-gates:
- All vehicles may pass through these gates. These sensors provide valuable information for the Preserve Rangers trying to understand the flow of traffic through the Preserve.
- Gates:
- These are gates that prevent general traffic from passing. Preserve Ranger vehicles have tags that allow them to pass through these gates to inspect or perform work on the roadway beyond.
- Ranger-stops:
- These sensors represent working areas for the Rangers, so you will often see a Ranger-stop sensor at the end of a road managed by a Gate. Some Ranger-stops are in other locations however, so these sensors record all traffic passing by.
- Camping:
- These sensors record visitors to the Preserve camping areas. Visitors pass by these entering and exiting a campground.
2 Roadway Map
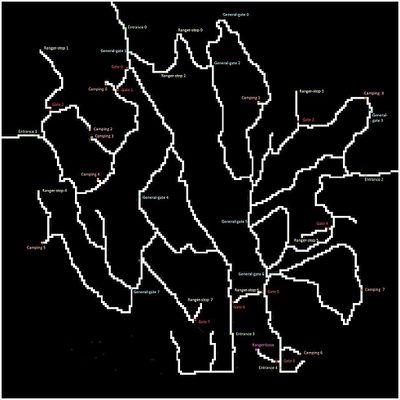
The contractors working with the Nature Preserve rangers have provided a map that presents the Preserve in terms of a 200x200 gridded area. The grid is oriented with north at the top of the map. Grid location (0,0) is at the lower left corner of the map (the SW corner). They have superimposed both the roadways and the sensor locations on this grid. The map shows an area 12 miles x 12 miles.
3 Others
- Traffic either passes through the Preserve, stay as day campers, or stay as extended campers.
- Preserve Rangers stay at the ranger-base toward the southeast of the Preserve when they are not working in the Preserve.
- The speed limit through the Preserve is 25 mph.
- The Preserve area does not observe "Daylight Savings Time".
- The roadways traveling southward from Entrances 3 and 4 do continue to other roadways outside of the Preserve area, but these are not shown on the map. Vehicle data will not reflect travel beyond the Preserve in this direction.
Data Preparation
1 Define episodes
Intuitively, each car-id (except for park service vehicles 2p) should possess two entrance records with one serves as entering and the other for exiting. However, it is noticed that many car-ids had more than two entrances recorded. It is rational to assume that these cars did made multiple visits to the preserve. Therefore, I split the trip with multiple entering and exiting of the same car-id into different episodes. Each episode can be seen as a complete trip and analysis is performed based on episodes.
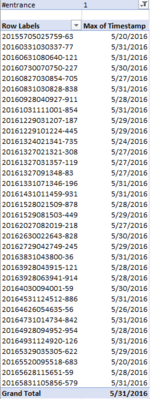
| 2 Exclude incomplete trips By looking at the maximum timestamp of the entire dataset, it is safe to conclude that the data provided is generated before June 2016. Therefore, there are vehicles with incomplete trips (the maximum timestamps of these car-ids are around end of May) in the dataset, and I exclude car-ids with only one entrance record. The figure on the right shows the car-ids with only one entrance record and their maximum timestamp. |
3 Remove duplicate records
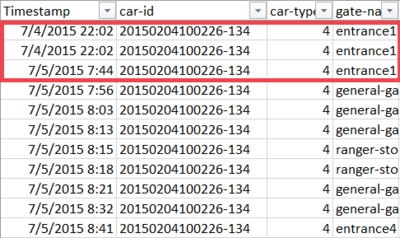
It is noticed that some sensor records are duplicated in the dataset, and these duplicates all have three entrance records for a car-id - the first two have the same timestamp (or very close timestamp), and the third one has a different timestamp and is coherent with the following activities. Hence, I remove the first two records assuming there were something wrong the data entry and keeping the third one makes more sense when interpreting the trip. The figure on the right shows an example of this kind of data anomaly. |
|
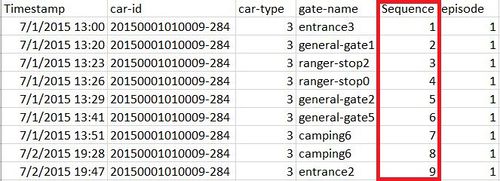
4 Label the sequence of gates of each episode In order to plot the entire routes of the vehicles, I create a new column named 'Sequence' to |
5 Concatenate the routes To concatenate the gate-names of each episode to form a route. |
| 6 Extract the gate-to-gate directions |
7 Calculate the gate-to-gate duration |
| 8 Extract the arrival timestamp of each episode |
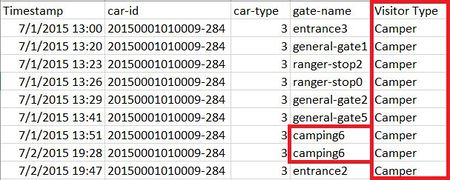
9 Segment the visitor types
|
10 Map coordinates of gates
|
Interactive Visualization
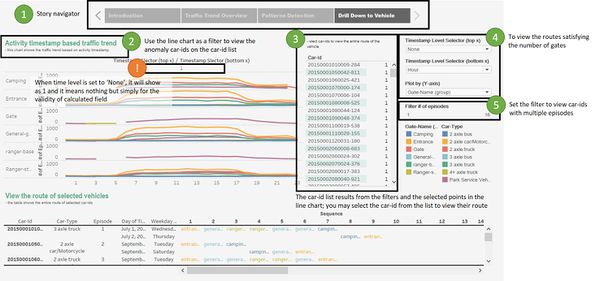
You may have your own investigation here: Link to interactive visualization
- Please be noticed that the link is not working well due to some unknown tableau server issue; please download the workbook via tableau public landing page.
Patterns of Life Analysis
Daily Patterns
| Images | Interpretations |
|---|---|
|
|
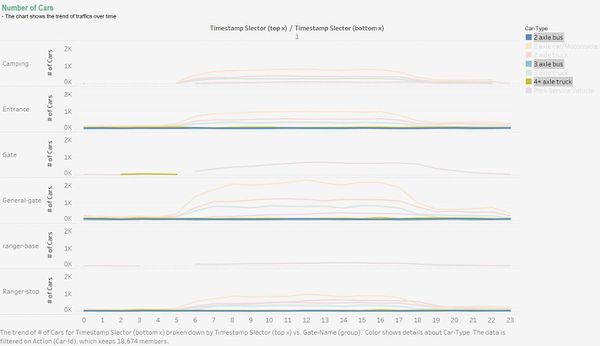
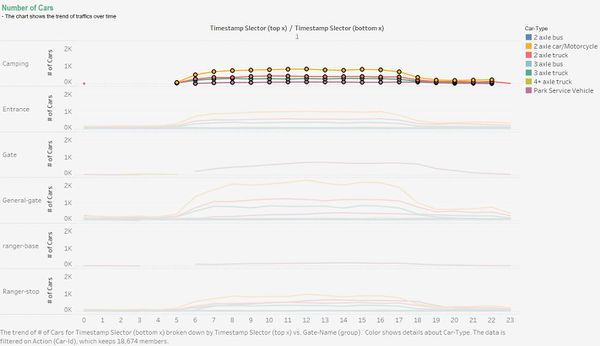
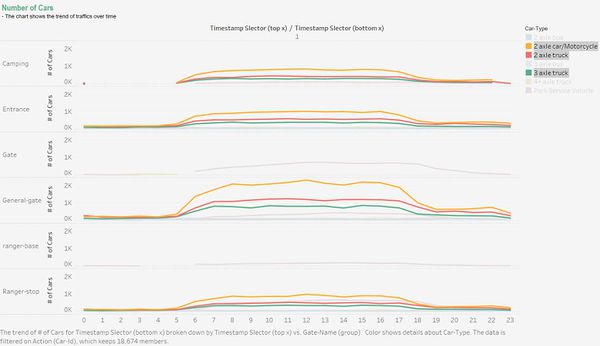
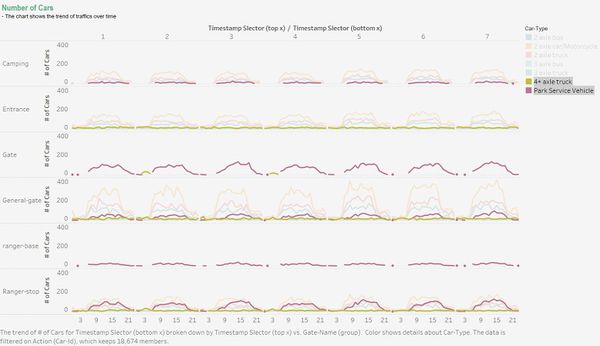
| The two types of buses and 4+ axle trucks, all large vehicles, had no appearance in any camping areas. It might represent that these three car-types can only be passing through the preserve, and camping area is not allowed for large vehicles. | |
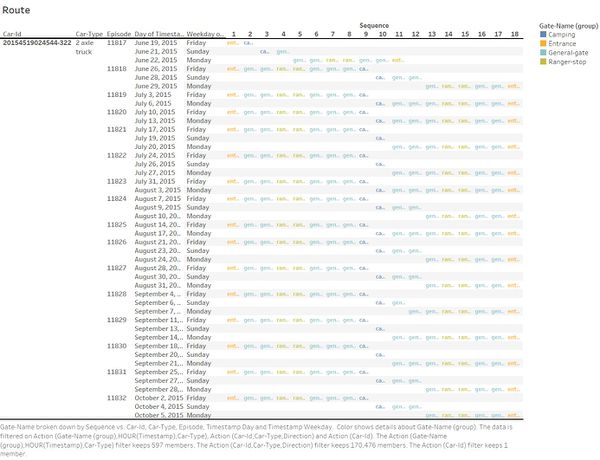
| Majority of traffics through camping areas only happened between 5am to 22pm, except for one car-id 20154519024544-322, which is discussed in later section. It might indicate that traffics were not allowed in camping areas after 22pm to ensure the safety and rest of overnight campers. | |
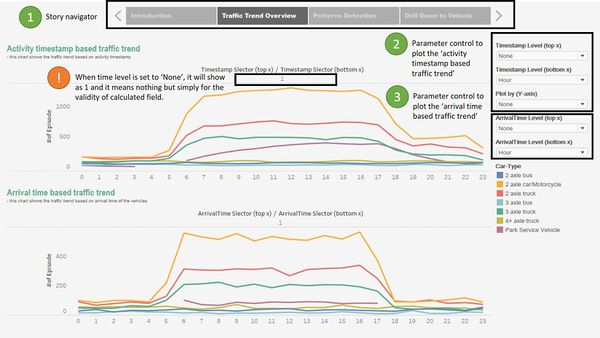
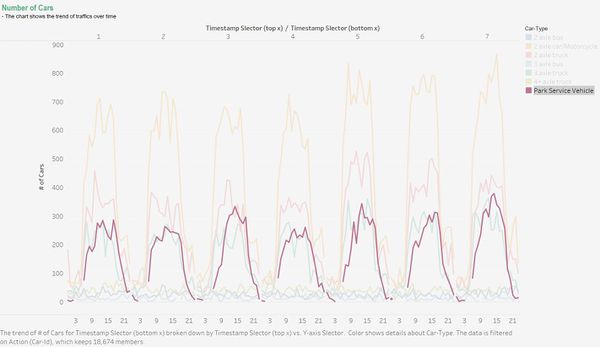
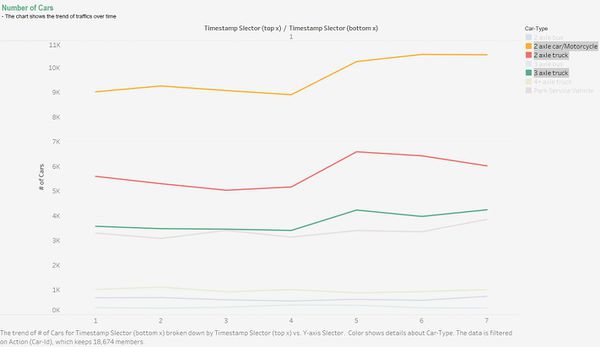
| 2 axle car/motorcycle, 2 axle truck, and 3 axle truck were most active vehicles in the preserve. Their activities started to increase at 6am and started to flatten out at around 18pm. 7am to 17pm had most vehicle activities. | |
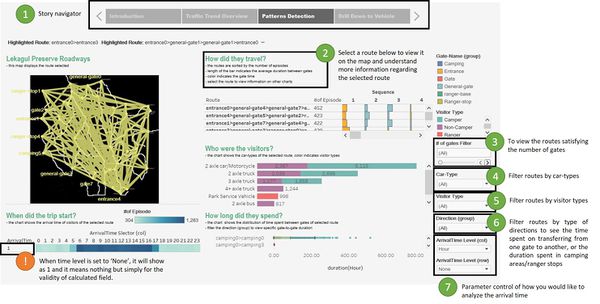
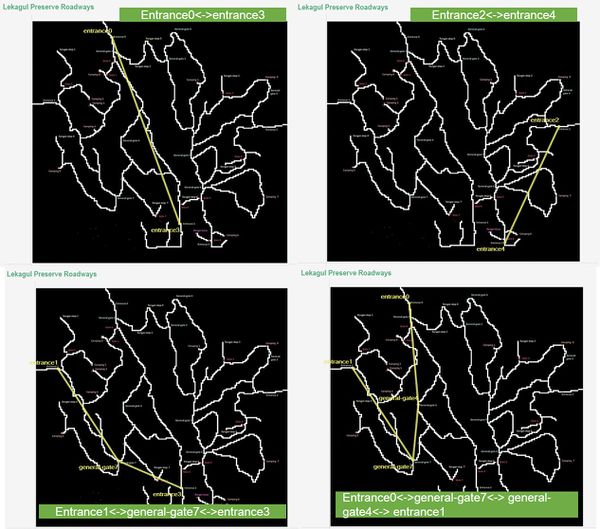
There were vehicles that simply passed the preserved without making any stops and looking around. These vehicles can be identified by investigating the number of gates they passed through. This pattern only applies to non-campers and happened within a short time period. The graph on the left shows all the possible routes for trespassing.
|
Longer-Period Patterns
| Images | Interpretations |
|---|---|
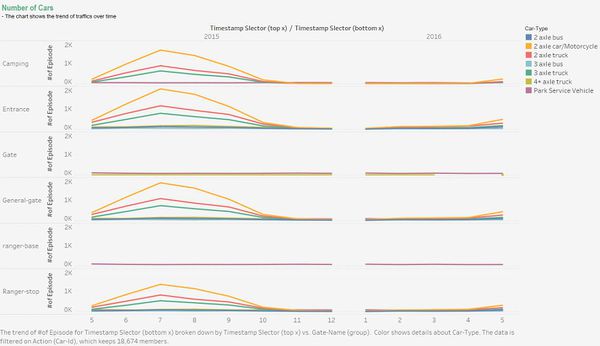
| Traffic increased since May and reached highest in July, then started to decrease. November to March were the least popular months for visitors and it is possible that these are winter months. | |
| Activities of 2 axle car/motorcycle, 2 axle truck and 3 axle truck increased on Friday and decreased on Monday. This can be explained by the overnight camping during weekends. | |
| The duration rangers spent at ranger-stops and camping areas were less than 1 hour. | |
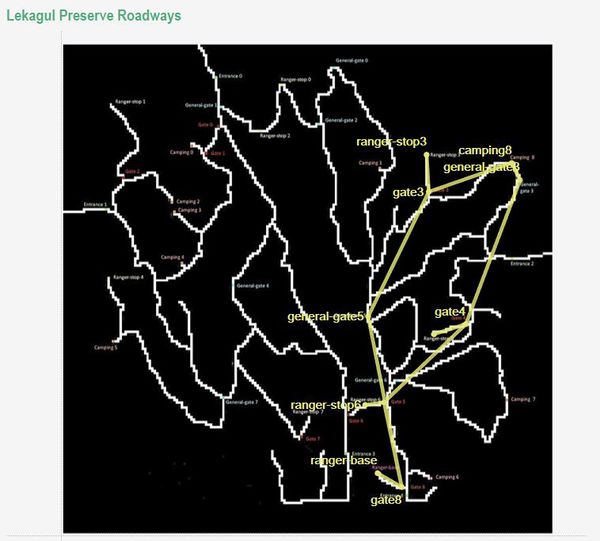
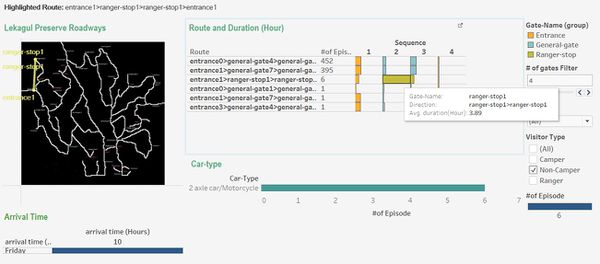
The graph shows the route that had most rangers' episodes. It was the most frequent patrol route of the rangers, and it was almost twice as frequent as the second most frequent patrol route. It is possible that the east side of the preserve required more care and protection.
|
|
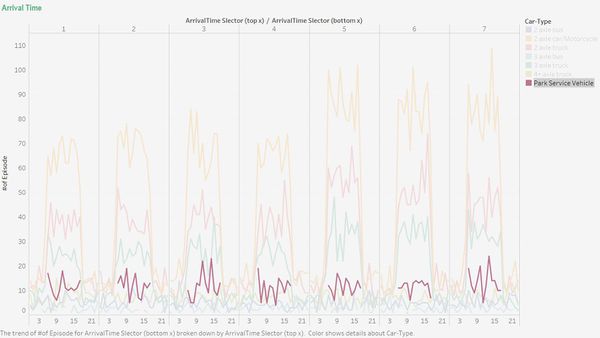
| Campers arrived at the preserve between 5am and 17pm. Friday to Sunday were more popular as expected. |
Unusual Patterns
| Images | Interpretations |
|---|---|
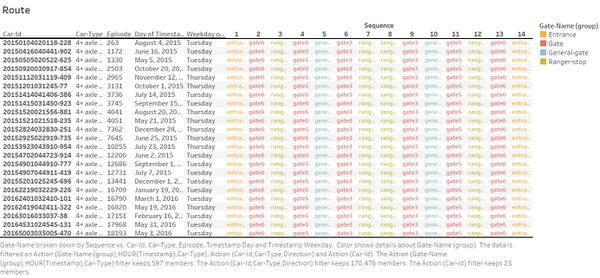
| This table displayed the route of car-id 20154519024544-322 (a 2 axle truck), which passed through camping gates after 22pm. This vehicle had 16 episodes, and each episode had exact same route except for the first episode. This vehicle came to the preserve each Friday and left the on the following Monday. | |
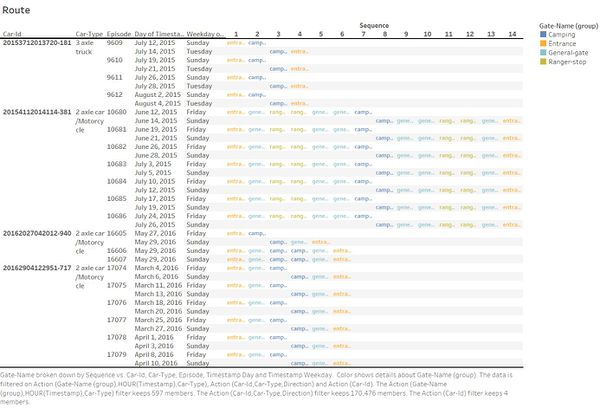
| Apart from 20154519024544-322, there were other car-ids that had multi-episodes, which means they did not render their car-id by the time they exited the preserve. And every time they came to the preserve, they followed the same routes and went for overnight camping. This group of visitors might hold a regular pass for their visits. | |
|
|
|
|
| Apart from the gate-skippers mentioned above, there were another 3 episodes made a simple round-trip in the preserve: they entered the preserve, passed through general-gate, then made the same route back to the entrance. |
Top 3 Possible Causes
- Long term visitor with car-id 20154519024544-322 and his behavior to travel pass camping areas during midnight.
- Unauthorized 4+ axle trucks invading restricted areas because the route they traveled was part of the most frequent patrol route of the rangers. This area could be where pipits resided, and therefore needed more care and protection from rangers. And the fact that they went through the restricted area when the rangers were off-duty makes them extremely suspicious.
- Possible over speeding which requires further investigations, especially for trespassing routes.
Comments & Discussions
comment1: Hi,Bijun. Amazing work! From you analysis pack, I can see the level of efforts that you have devoted into this assignment. Yet, I have the following suggestions that hopefully are useful in further improving your work:
Overall, fantastic work! Hopefully my comments can add value
|
| Hi Joyce, Great overall effort and very engaging. Some of my feedback as below 😉
Clarity:
Cheers, |
| comment3
Hi Zheng Bijun, Please find my feedback comments as follows. You present a very nice analysis, which is answering the questions of the challenge. With regard to the clarity and aesthetics aspect, I have the following to add. Clarity :
Aesthetics:
Hope the feedback helps, and please leave out a feedback on my page as well. You may access it here.
Thank You, Kishan Bharadwaj Shridhar |
| comment4 |
| comment5 |
