ISSS608 2016-17 T3 Assign WANG YINGBEI
Contents
VAST Challenge 2017: Mini-Challenge 1
As part of his investigation, ornithology student Mitch Vogel needs to examine the movement of traffic through the Boonsong Lekagul Nature Preserve. His first working hypothesis is that there is some link between the traffic going through the preserve and the decline in the nesting Rose-crested Blue Pipit—maybe the traffic noises are drowning out mating calls! Or perhaps he can discover some odd goings on in the traffic patterns—perhaps campers are invading the bird’s habitat areas?
There are park rangers working as caretakers of the nature preserve, and they have been collecting traffic data for their annual reporting to the local government. They have provided Mitch with some data, explanations about the data, and a map. Mitch feels unprepared to analyze this information alone and is asking you to help with your visual analytics prowess.
Use visual analytics to analyze the available data and develop responses to the questions below. In addition, prepare a video that shows how you used visual analytics to solve this challenge. Novel visual Insert non-formatted text here visualizations and analysis approaches are especially interesting for this mini-challenge. Please do not use any other data in your work (including other Internet-based sources or other mini-challenge data).
Questions
- “Patterns of Life” analyses depend on recognizing repeating patterns of activities by individuals or groups. Describe up to six daily patterns of life by vehicles traveling through and within the park. Characterize the patterns by describing the kinds of vehicles participating, their spatial activities (where do they go?), their temporal activities (when does the pattern happen?), and provide a hypothesis of what the pattern represents (for example, if I drove to a coffee house every morning, but did not stay for long, you might hypothesize I’m getting coffee “to-go”). Please limit your answer to six images and 500 words.
- Patterns of Life analyses may also depend on understanding what patterns appear over longer periods of time (in this case, over multiple days). Describe up to six patterns of life that occur over multiple days (including across the entire data set) by vehicles traveling through and within the park. Characterize the patterns by describing the kinds of vehicles participating, their spatial activities (where do they go?), their temporal activities (when does the pattern happen?), and provide a hypothesis of what the pattern represents (for example, many vehicles showing up at the same location each Saturday at the same time may suggest some activity occurring there each Saturday). Please limit your answer to six images and 500 words.
- Unusual patterns may be patterns of activity that changes from an established pattern, or are just difficult to explain from what you know of a situation. Describe up to six unusual patterns (either single day or multiple days) and highlight why you find them unusual. Please limit your answer to six images and 500 words.
- What are the top 3 patterns you discovered that you suspect could be most impactful to bird life in the nature preserve? (Provide a short text answer.)
Data Prerparation
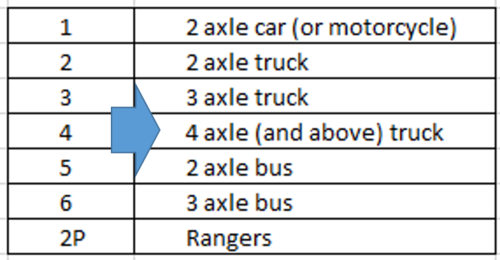
1. Edit the car type labels to their names
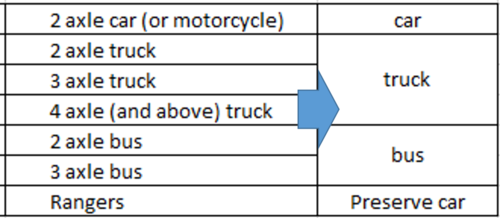
2. Group car types
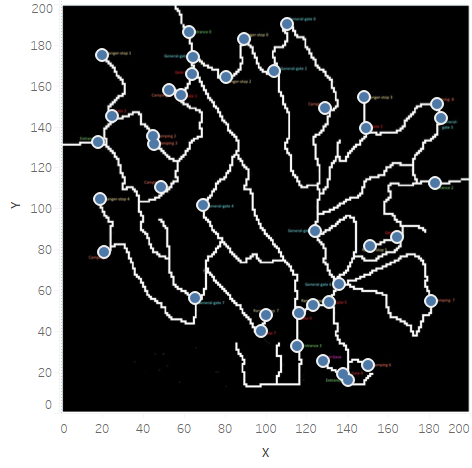
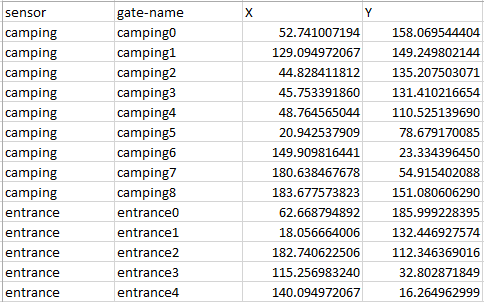
3. Allocate sensors
Using tableau annotation --> point to point out the axis of each sensor, and record down the axis values into the excel.
The map dataset will be joined with the main dataset in the tableau.
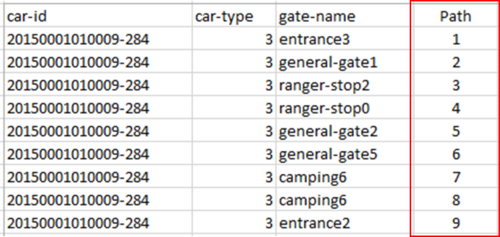
4. Numbering path sequence
Numbering the path sequence for each car-id
5. Group the gate-name to get the entire route for each car-id
6. Count the number of gate-name for each car id to get the total number of sensors they have passed
Pattern Uncover & Analysis
Daily Life Pattern
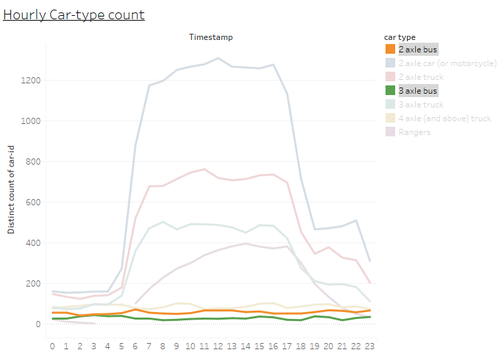
- Peak hour pattern: Peak hours of vehicles activate in the preserve is 6am to 7pm, and less active in other times. This peak hour pattern is obviously shown for vehicles other than the bus.
- Bus daily pattern: Unlike other vehicles, the bus has no “peak activation hours” daily. They have traveled around the preserve all the time daily.
- Preserve car daily schedule: preserve cars are vacant from 4-6am daily. They do not travel in the park at all during this time of period. Moreover, the weekly schedule of the preserve cars is shown as below:
| Weekday | Extra non-working hours (h) |
|---|---|
| Sunday | 0 |
| Monday | 1 (3-4am) |
| Tuesday | 1 (3-4am) |
| Wednesday | 1 (3-4am) |
| Thursday | 2 (2-4am) |
| Friday | 0 |
| Saturday | 3 (1-4am) |
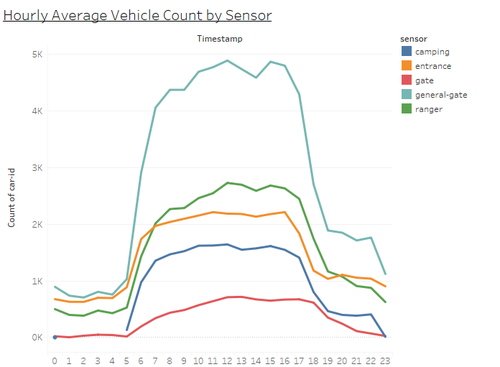
- Daily traffic flow pattern: The traffic flow in the preserve starts to be heavy from 6am. The heavy traffic flow will keep until 5pm and start to decrease. The heavy traffic flow will be released at 7pm.
- Entrance daily pattern: The peak hour for vehicles come into or get out from the park is 6am-6pm. There are almost twice of the vehicles get through entrances during this peak time period of other periods.
- Camping site daily pattern: There is no vehicle has been catch by camping sensors from 1 to 5am. This may be because that camping site is not open during this time period. Moreover, the peak time of vehicles come to camping is from 6am to 7pm, which is the same time period of daily traffic flow peak hours.
Long Term Pattern
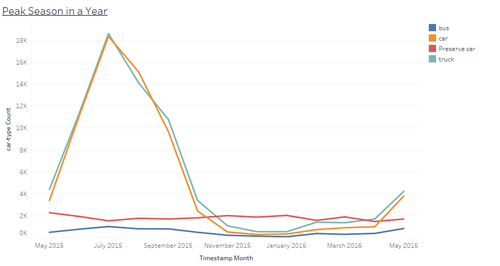
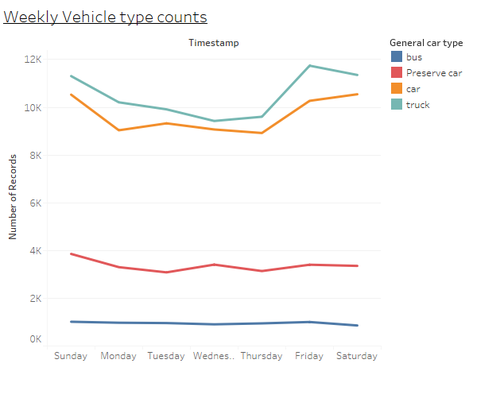
- Summer tourist pattern: The peak season in a year for both car and truck starts from May, and the number of cars and trucks keep increase until reach a peak in July. The number of cars and trucks in the preserve have been decreased after July. The peak is probably due to summer vacation, there are more tourists coming to the preserve and there needs more commodities or food which are transferred by trucks to the park.
- Car type duty pattern: Unlike car and truck, the number of preserve cars and bus do not increase or decrease significantly. This may be due to they are vehicles which provide daily duties and daily passenger transferring. More passengers in summer will be transferred by cars.
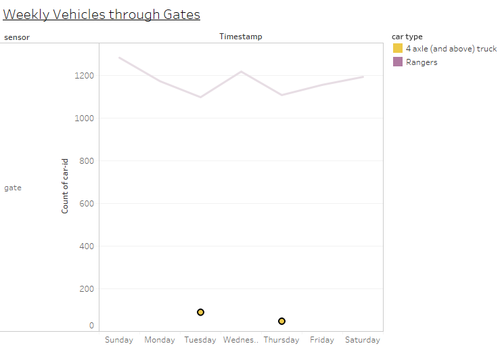
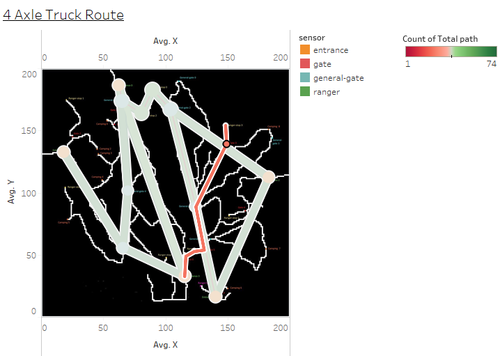
- 4 axle getting through gate pattern: Gates are used to prevent general traffic from passing. Except for rangers who get through the gates daily for their daily duty, the 4 axle trucks is the only car type which is allowed to get through the gate. They can only access the gate on Tuesday and Thursday. This is probably because they need to transfer something into the gate, such as commodities for rangers at the ranger-stop, or some preservation related goods.
- Crowded weekend pattern: The number of cars and trucks are more activated in the park on Friday, Saturday and Sunday than other days. This is because that more tourists are around during weekend. Due to the limit number of bus the preserve has, the number of buses observed by sensors are constantly along all weekdays.
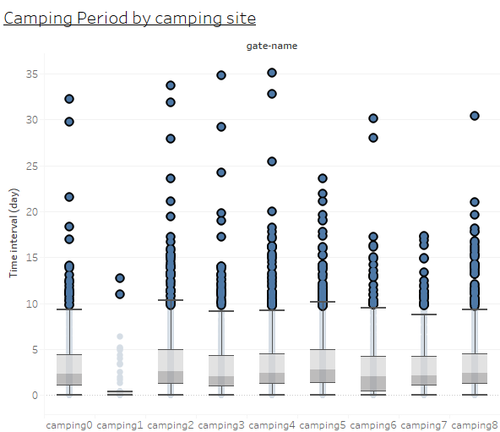
- Camping site staying pattern: Some tourists are coming to the preserve for camping for over few days. Among all camping site, camping1 has least tourists and shortest camping period. There are two possible theories behind this: 1) the equipment or the sight seen at camping1 is not as attractive as other camping sites. 2) the preserve park has limited the number of campers and time period to stay in camping1 for the goodness of reservations.
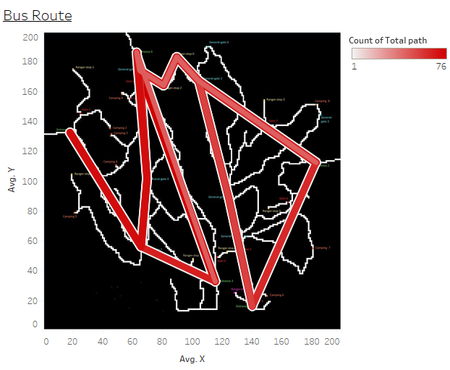
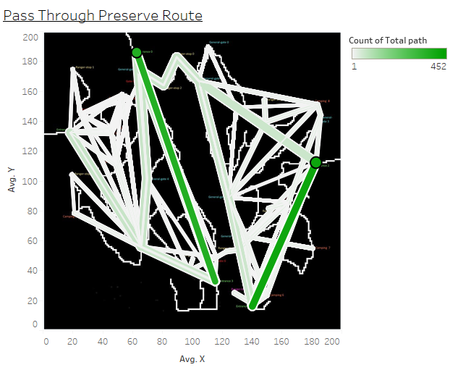
- Bus route:
entrance0-->general-gate1-->ranger-stop2-->ranger-stop0-->general-gate2-->entrance2
entrance3-->general-gate1-->ranger-stop2-->ranger-stop0-->general-gate2-->general-gate5-->entrance4
entrance0-->general-gate4-->general-gate7-->entrance1
entrance0-->entrance3
entrance2-->entrance4
- Three main routes for passengers to pass through the preservation park:
entrance2-->entrance4
entrance0-->entrance3
entrance0-->entrance3
Unusual Pattern
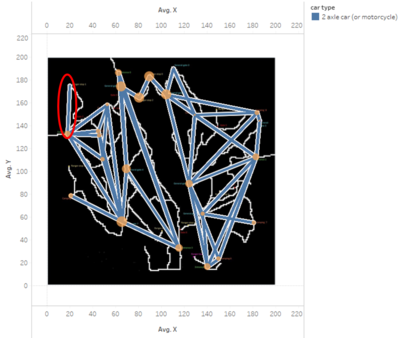
- Unauthorized access to ranger-stop1: There are 6 2 axle cars get into ranger-stop1 which only allows for rangers to access. Moreover, they have not gone through gate2 which is the only access to ranger-stop1. Their route: entrance1-->ranger-stop1-->ranger-stop1-->entrance1
- Extremely active passengers: vehicles are extremely active in the park who have more than 60 stops in the park. The three outliers: 20155705025759-63, 20154112014114-381, and 20154519024544-322 has 70, 98, and 281 stops respectively. Moreover, 20155705025759-63 does not leave the park yet, since its final recording is at camping5.
- Unauthorized access of trucks to ranger stops: 4 axle trucks have been gone to ranger stop3 which only allows rangers to access.
Significant Patterns for the Preserve
- The 6 2 axle cars which directly go from entrance 1 to ranger-stop1 without gone through gate2. In average, each of these 6 cars has been gone to the rangerr-stop1 twice. It is hard to know what their intention to do so.
- It is suspect why the three vehicles are in the park for such a long time period so that they can have 70, 98, and 281 stops. These suspect behaviours might lead to bird hurt.
- There are quite lots of tourists coming to the preservation for camping, and also trucks coming to transfer goods maybe, all these would influence the environment in the park as well.
Comment
|
Comment 1: Hi Yingbei, First of all, the wiki page of your assignment is succinct and well organised without some confusing navigations. Secondly, I do see that your visualisation reveals some useful insights through various charts. And you also highlighted some important points on the chart, which makes more sense with your words explanation. Overall, you did quite a good job. Please find my feedback and comments as follows: Data Preparation I find the Data Preparation section is missing in your current submission. In doing data analytics and data visualization, I regard data preparation as a critical process which would reflect your thinking processes. I feel that data preparation cannot be done at one shot but iteratively. Your assignment would be complete and better with data preparation. Data Visualization
Hope my feedback and comments may be helpful. Please also leave your feedback and comments to my page. Thank you. :) Cheers, Lingfei |
|
Comment 2: Hi Yingbei, Well done! I really enjoyed reading your data visualization. There are a few suggestions as below:
Thanks for your sharing! Hope my comments can help.
Regards,
|
