ISSS608 2016-17 T3 Assign RISHI TANDON
We have Mistford a city with a large industrial area in the nature preserve region.
The study is about 4 factories which are releasing 4 sets of chemicals into the air. The local Mistford Government has stepped in to monitor the situation and according step up to take action.
The local government has been monitoring the air quality and conducted it's own studies in the region.
The 4 factories are: 1. Kasios Office Furniture 2. Indigo Sol Boards 3. Roadrunner Fitness Colour Electronics 4. Radiance ColorTec
The 4 chemicals tracked are: 1. AGOC 3A 2. Chlorodinine 3. Applumonia 4. Methylosmolene
Data Preparation:
The location data available includes X,Y, Type and Name. The data preparation was done in R.
Questions The primary goal is to determine which factory (if there is any) is, contributing to the reduced population of RBPs in Mistford. To achieve this goal, the following questions are identified:
Q1: Characterize the sensors’ performance and operation. Are they all working properly at all times? Can you detect any unexpected behaviors of the sensors through analyzing the readings they capture?
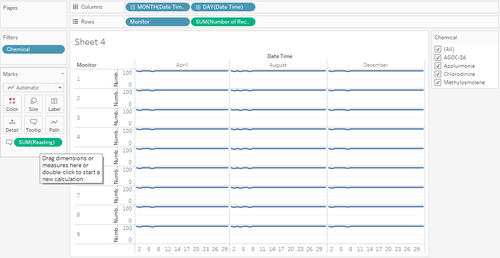
A1: The sensor performance varies based on the chemicals detected and the performance measurement can be seen in the diagrams below.
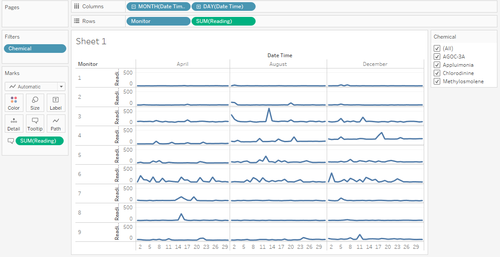
April It may be clearly highlighted that both monitor 6 and monitor 3 would constantly show extremely high readings throughout the day. This can be seen in Figure 1 as shown below. Also, there are certain outliers which are evident and can be traced to the respective months and days, however is not visible here in the graph shown.
August: Among the monitors its seen that the 3rd monitor shows the highest readings.
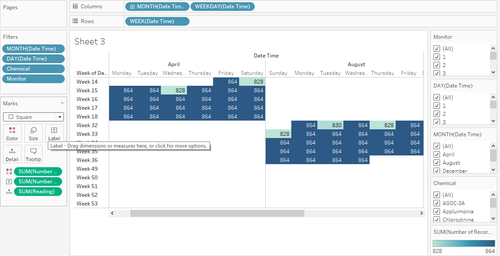
December: Its clear that for December monitor 3 is showing the highest reading. Here we have used the calendar plot as seen in Figure 3.
Q2: Now turn your attention to the chemicals themselves. Which chemicals are being detected by the sensor group? What patterns of chemical releases do you see, as being reported in the data?
A2: The patterns are explained as follows: With reference to the graphs below we can understand the chemicals and the patterns in which they affect the release. For December it's evident that there is a rampant change starting in the second month and it continues for five months. The different readings of the monitors can be seen clearly. In the months of August and April there is a clear relation and similarity in trend components. Its seen from the calendar plots that visual insights may be generated. The records in April are low for almost every chemical reading which falls in the 2nd and the 6th month respectively. In the month of August it's repeated in month 2, 4 and 6 respectively.
Q3: Which factories are responsible for which chemical releases? Carefully describe how you determined this using all the data you have available. For the factories you identified, describe any observed patterns of operation revealed in the data.
A3: This needs to be seen chemical wise and needs to be visualized via the monitor readings.


