ISSS608 2016-17 T3 Assign MAO CHENXIN
Contents
Problem and Motivation
The relationship between nature and human activities is a constant theme. This report is concerned with the traffic and vandalism, happened from May 2015 to May 2016 at Boonsong Lekagul Nature Preserve, that compensated for the decline in the nesting Rose-crested Blue Pipit. It is scoured from VAST Challenge 2017- Mini Challenge 1.
Mini Challenge 1
Mistford is a mid-size city is located to the southwest of a large nature preserve. The city has a small industrial area with four light-manufacturing endeavors. Mitch Vogel is a post-doc student studying ornithology at Mistford College and has been discovering signs that the number of nesting pairs of the Rose-Crested Blue Pipit, a popular local bird due to its attractive plumage and pleasant songs, is decreasing! The decrease is sufficiently significant that the Pangera Ornithology Conservation Society is sponsoring Mitch to undertake additional studies to identify the possible reasons. Mitch is gaining access to several datasets that may help him in his work, and he has asked you (and your colleagues) as experts in visual analytics to help him analyze these datasets.
The Boonsong Lekagul Nature Preserve is used by local residents and tourists for day-trips, overnight camping or sometimes just passing through to access main thoroughfares on the opposite sides of the preserve. The entrance booths of the preserve are monitored in order to generate revenue as well as monitor usage. Vehicles entering and exiting the preserve must pay a fee based on their number of axles (personal auto, recreational trailer, semi-trailer, etc.). This generates a data stream with entry/exit timestamps and vehicle type. There are also other locations in the part that register traffic passing through. While hiking through the various parts of the preserve, Mitch has noticed some odd behaviors of vehicles that he doesn’t think are consistent with the kinds of park visitors he would expect. If there were some way that Mitch could analyze the behaviors of vehicles through the park over time, this may assist him in his investigations.
Questions to Answer
- “Patterns of Life” analyses depend on recognizing repeating patterns of activities by individuals or groups. Describe up to six daily patterns of life by vehicles traveling through and within the park. Characterize the patterns by describing the kinds of vehicles participating, their spatial activities (where do they go?), their temporal activities (when does the pattern happen?), and provide a hypothesis of what the pattern represents (for example, if I drove to a coffee house every morning, but did not stay for long, you might hypothesize I’m getting coffee “to-go”). Please limit your answer to six images and 500 words.
- Patterns of Life analyses may also depend on understanding what patterns appear over longer periods of time (in this case, over multiple days). Describe up to six patterns of life that occur over multiple days (including across the entire data set) by vehicles traveling through and within the park. Characterize the patterns by describing the kinds of vehicles participating, their spatial activities (where do they go?), their temporal activities (when does the pattern happen?), and provide a hypothesis of what the pattern represents (for example, many vehicles showing up at the same location each Saturday at the same time may suggest some activity occurring there each Saturday). Please limit your answer to six images and 500 words.
- Unusual patterns may be patterns of activity that changes from an established pattern, or are just difficult to explain from what you know of a situation. Describe up to six unusual patterns (either single day or multiple days) and highlight why you find them unusual. Please limit your answer to six images and 500 words.
- What are the top 3 patterns you discovered that you suspect could be most impactful to bird life in the nature preserve? (Provide a short text answer.)
Dataset
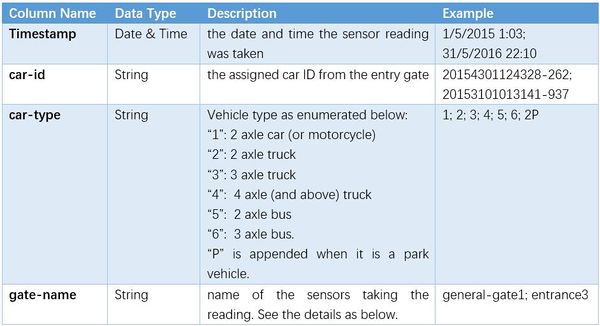
There are 2 main data sources: a CSV file “Lekagul Sensor Data” containing data recorded from sensors around this nature preserve and a preserve map with the locations of roadways and the sensors.
Traffic Patterns of Life through the Preserve
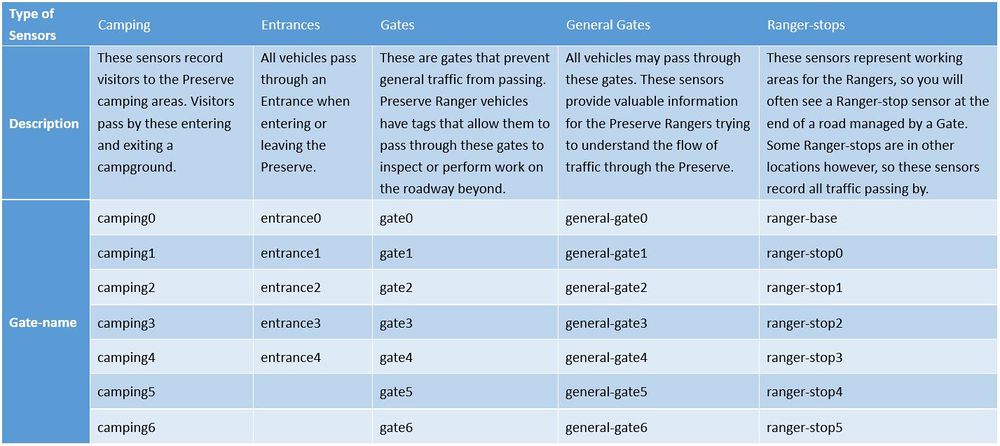
Traffic enters and exits the Preserve through official Entrances. There are several Campgrounds where both day-camping and overnight camping are allowed. There are certain roadways restricted to the Preserve Rangers only. The Preserve Rangers are monitoring traffic through various segments of the Preserve, so other sensors are found in various other locations.
Entry gates are positioned at the Preserve entrances. Each vehicle receives an entry ticket at the gate and is assigned a vehicle class; the entry is recorded. The entry ticket contains an RF-tag that enables the Preserve sensors to pick up the passage of a vehicle through the Preserve. Each vehicle surrenders their entry ticket when exiting the Preserve and the exit is recorded.
Preserve Map
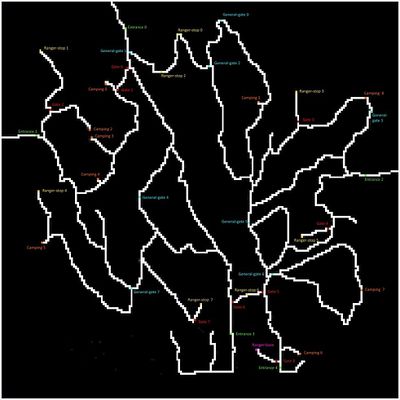
Two maps with labels and without labels are provided. The map presents the Preserve in terms of a 200x200 gridded area. The grid is oriented with north at the top of the map. Grid location (0,0) is at the lower left corner of the map (the SW corner). They have superimposed both the roadways and the sensor locations on this grid. The map shows an area 12 miles x 12 miles.
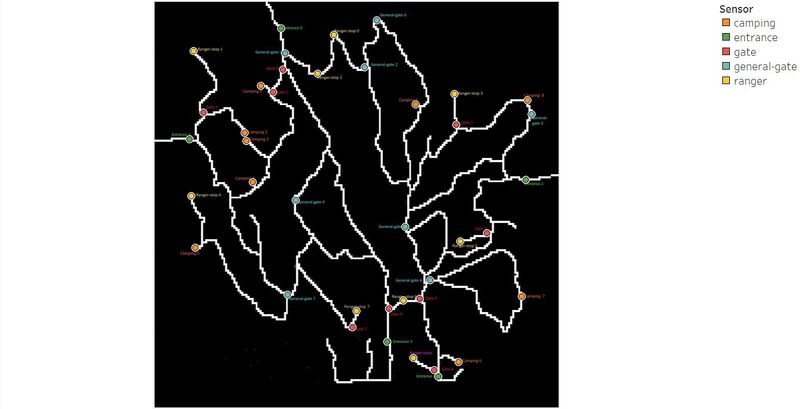
Roadways are indicated by white colored pixels on the map. Each sensor type has its own unique color: Entrances (green), General-gates (blue), Gates (red), Ranger-stops (yellow), and Camping (orange).
Other Information
- Traffic either passes through the Preserve, stay as day campers, or stay as extended campers.
- Preserve Rangers stay at the ranger-base toward the southeast of the Preserve when they are not working in the Preserve.
- The speed limit through the Preserve is 25 mph.
- The Preserve area does not observe “Daylight Savings Time”.
- The roadways traveling southward from Entrances 3 and 4 do continue to other roadways outside of the Preserve area, but these are not shown on the map.
- Vehicle data will not reflect travel beyond the Preserve in this direction.
Tools Utilized
- Tableau 10.2
- JMP Pro 13
Data Preparation
Preserve Map
Created a new excel file with the sensor, gate-name data and coordinates of each gate-name. Note that the values of the first line of coordinates are (200, 200) because the map is a 200x200 gridded data.
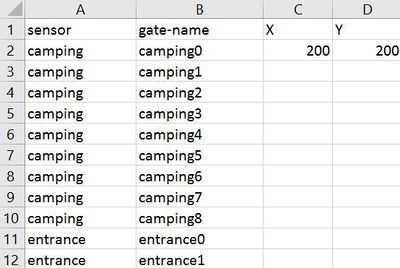
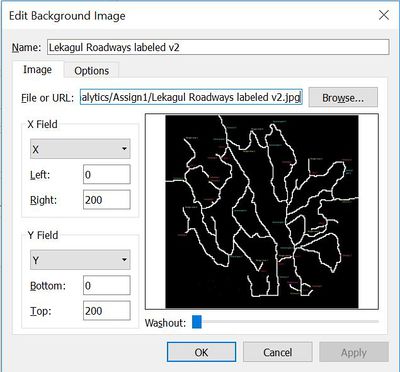
Connected the dataset in Tableau and added the map with labels as background image. Set the X as X field and Y as Y field and specify the borders. Ticked the option “Always Show Entire Image”.

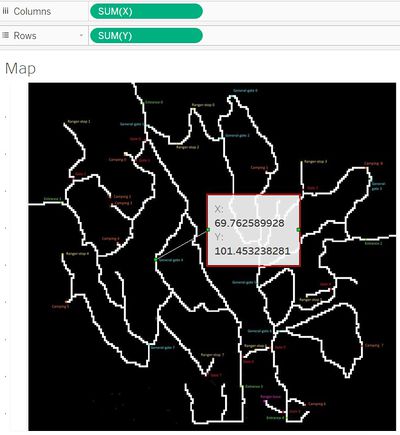
Filled the X aixs on Columns and Y axis on Rows. Right-clicked on each gate-name and selected “Annotate” – “Point”. Recorded all the coordinates in the previous excel workbook.
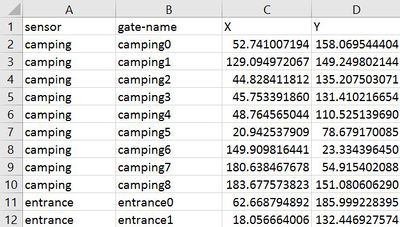
Refreshed the data scource in Tableau workbook and use the gate-name as detail to plot in the map, checking if the coordiantes correspond to the gate-names correctly. Removed the point annotation and headers of axies. Used the sensor as the color and remain them matched with the the color of labels.
Traffic Patterns of Life through the Preserve
Loaded the excel file into JMP, split the column gate-name into multiple stops and renamed them as "route" with sequence number. Exported as csv file as below.

Variable Transformation
Loaded the csv file we exported above into Tableau.
Created a calculated field "Traffic" to count the distinct number of car.

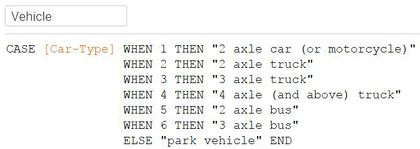
Transformed the variable "Car-Type" to "Vehicle" with the text description of different car types instead of confusing plain numbers.
Results
The visualization can be found in Tableau Public.
Question 1: Daily patterns of life by vehicles
Number of unique cars in the day
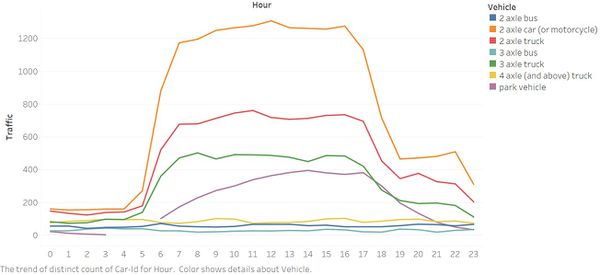
From the daily traffic in 24 hours:
- 2 axle car (or motorcycle), 2 axle truck and 3 axle truck were the most popular car types. For these 3 types of cars, most activities happened from 5am to 22pm (except one car with id 20154519024544-322). 7am to 4pm was the peak time.
- For park vehicle (with the type "2P" in the dataset), the working hours is from 6am to 3am (next day). At 17pm, the number of rangers' cars decreased significantly, when the numbers of 2 axle car (or mobile), 2 axle truck and 3 axle truck decreased as well.
- No obvious changes of time for the other 3 types of cars - 2 axle bus, 3 axle bus and 4 axle (and above) truck. Besides, these 3 types of cars account for the least traffic in the preserve from May 2015 to May 2016.
Number of unique cars in the day by sensors
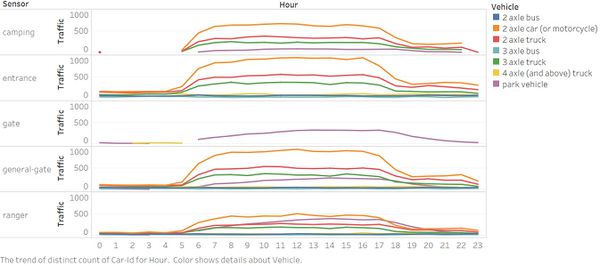
From the daily traffic by sensors:
- For camping, there are only three types of cars - 2 axle car (or motorcycle), 2 axle truck and 3 axle truck. Almost all of these cars traveled in and out the camping site from 5am to 22pm.
- Only Park Vehicle and 4 axle (and above) truck accessed gate, from 6am to 2am and from 2am to 5am respectively.
Question 2: Long-term patterns
Number of unique cars in the week
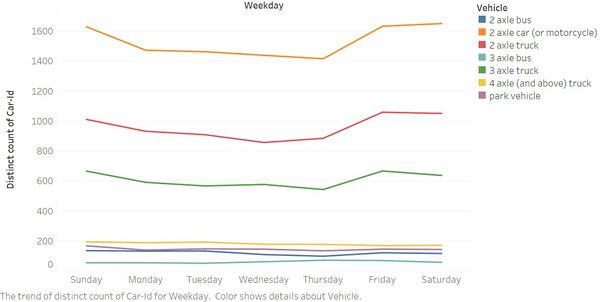
From the weekly traffic:
- 2 axle car (or motorcycle), 2 axle truck and 3 axle truck were the most popular car types used in the preserve. For these 3 types of cars, most activities happened on weekends (from Friday to Sunday).
- No obvious changes of time for the other 4 types of cars - 2 axle bus, 3 axle bus, 4 axle (and above) truck and park vehicle ("2P").
Number of unique cars in the month
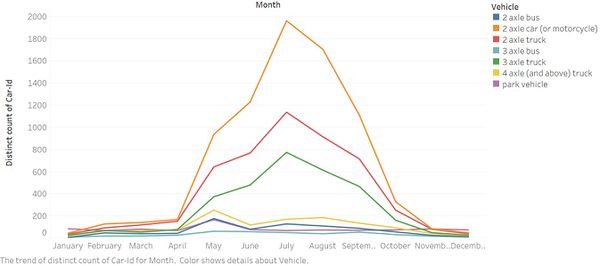
From the monthly traffic:
- 2 axle car (or motorcycle), 2 axle truck and 3 axle truck were the most popular car types used in the preserve.
- Almost all the car types follow the seasonal popularity: summer (June - August) is the most popular season, followed by autumn (September and October) and spring (April and May), except 3 axle bus.
Horizon chart of traffic by sensors
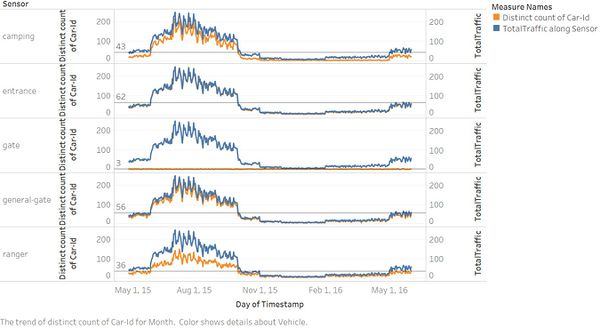
Horizon chart for comparing difference of traffic
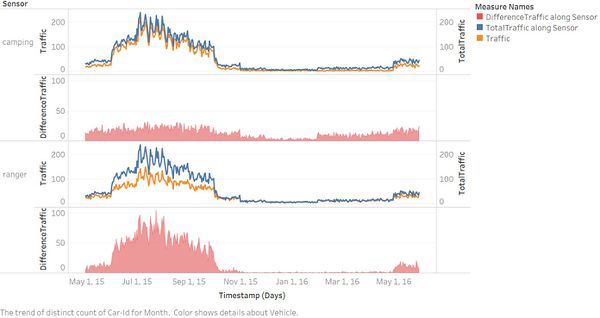
From the horizon chart of traffic by sensor:
- Apart from rangers, most visitors came to the preserve for camping.
- Take camping and ranger a closer look at. Compared with the same month (May) in 2015, the traffic of 2016 May increased a little, indicating that the preserve will be more popular in 2016.
Question 3: Unusual patterns
Route map of an unusual pattern
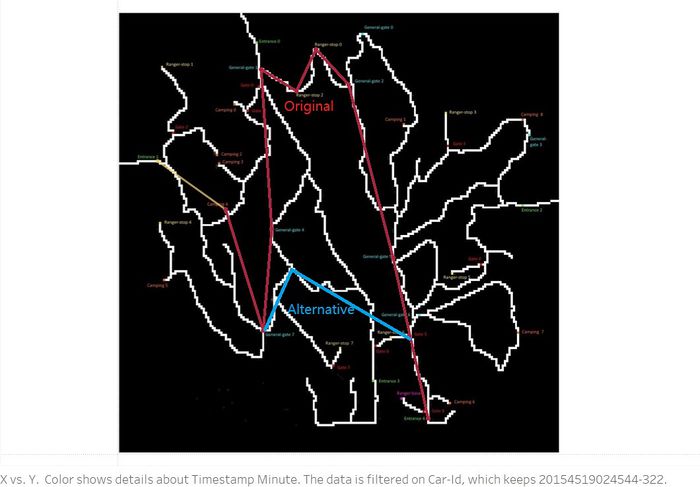
From the route of a car (id: 20154519024544-322):
- After entering the preserve from entrance 1 on 19th June, this car traveled in and out the preserve for 16 times in the same frequency during the following 108 days through entrance 4! Interestingly, it spent more time in other areas than that in the camping site 4. What kind of scenery along the route can attract them to visit the same place every three days for constant three months?
- If this car was to go camping, why it always and only it left the camping site 4 after 22pm?
- If it wanted to leave from entrance 4, why they drove around the preserve every time instead of taking a quicker and more convenient route (marked in blue as "Alternative")?
Question 4: Top3 impactful to birds
- Overnight camping, which is the main activities in the preserve, may hurt the birds intentionally or unintentionally, especially in some camping sites with dense distribution of birds (Unfortunately, the information of distribution of birds was not provided).
- The real purpose of the car (id: 20154519024544-322) with the strange behavior traveled frequently should be examined carefully.
- Driving at high speed may disturb or hurt the birds, which needs further study.
Reference
1. VAST Challenge 2017- Mini Challenge 1
Comments
Please feel free to provide your valuable comments! Thank you.
—— Chenxin
|
Comment 1: Hi Chenxin, First of all, the wiki page of your assignment is succinct and well organised without some confusing navigations. Secondly, I do see that your visualisation reveals some useful insights. Please find my feedback and comments as follows: Data Preparation I find the Data Preparation section is missing in your current submission. In doing data analytics and data visualization, I regard data preparation as a critical process which would reflect your thinking processes. I feel that data preparation cannot be done at one shot but iteratively. Your assignment would be complete and better with data preparation. Data Visualization
Hope my feedback and comments may be helpful. Please also leave your feedback and comments to my page. Thank you. :) Cheers, Lingfei |
|
Comment 2:
Best Wishes,
|