ISSS608 2016-17 T3 Assign LIU XINTIANLIU XINTIAN Data preparation
|
|
|
|
|
|
Data Preparation
Data Processing
For question 1 and question 2, although there are some missing values, we don’t need to deal with them but put them into the unnormal behaviour and improperly working of sensors.
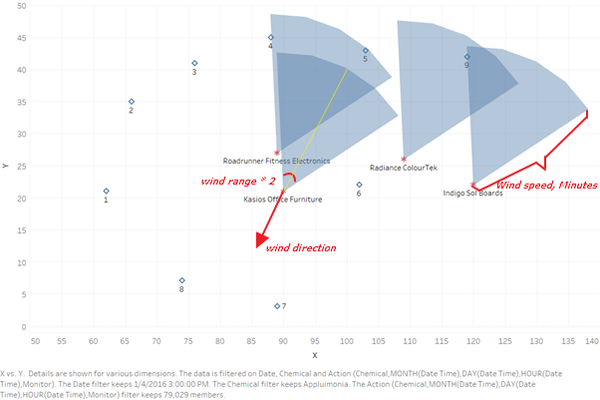
For question 3, we need to build a map including the visualization of wind speed and direction, the location of 9 sensors and 4 factories and the adjustable parameters of wind range. We use the approximately fan-shaped graph to represent the wind range of each time. Four fan-shaped graphs are related to four factories and the overlap of the fan-shapes means the area that wind can bring the pollutants to.
Wind Visualization
We use the coordinates of factories to be the centre points of four fan-shapes. The arc is a line of five point which is decided by the wind direction and wind range.
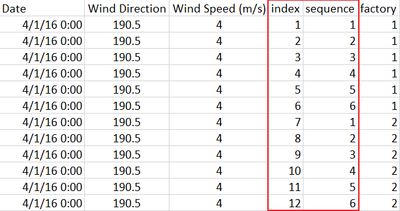
First, we need to calculate the length of each grids and set the location of sensors and factories. We find that 1 meter equals 0.01036 grid. Then, transform wind direction and wind speed to the coordinates along X and Y axis. So, we do some data processing in excel. We add a column called “index” to determine the calculation field of coordinates. And another column called “sequence” to decide the path.
After these steps, turn to tableau and make calculation fields. We add two parameters to control the degree and radius of the so-called fan-shape.
Here we show the coordinates of X axis of “Roadrunner Fitness Electronics” factory to be an example. Wind direction means the origin of the wind so that we add some calculations to make sure the area of fan-shape is the area of wind.
The graph below shows the wind visualization at 3pm, Apr 1st. The parameter of “Minutes” and “Wind range” can be changed in certain condition. So, this graph shows the combination of location and wind information, which is useful for the third question.


