ISSS608 2016-17 T3 Assign KISHAN BHARADWAJ SHRIDHAR The story unfolds
The real truth
Patterns of life analysis will be revealed in this page, what exactly is happening at the reserve.
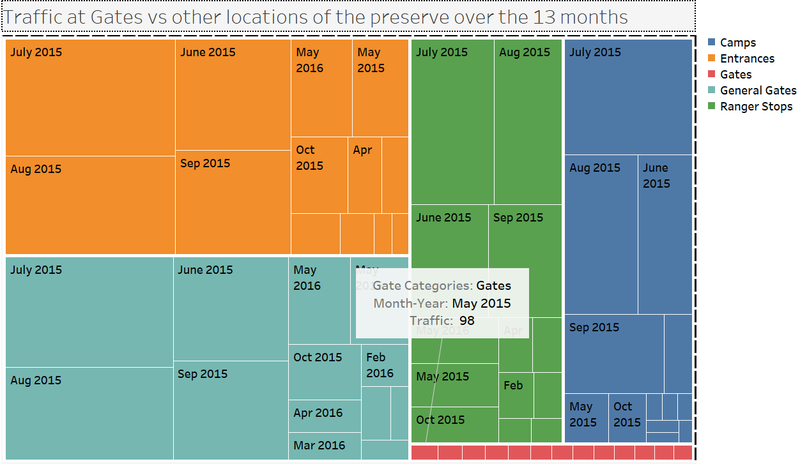
Finding #1: There is constant traffic at the gates as compared to the other zones across the 13 months of observation.
Steady stream of traffic in gates while in other gates, they vary across the timespan
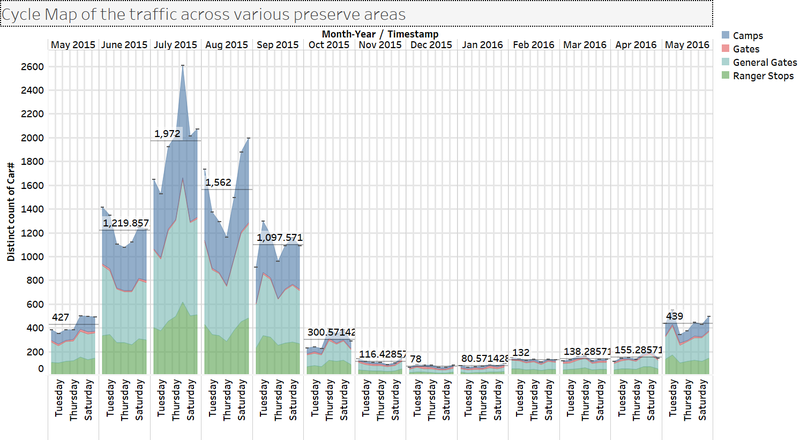
As compared to all the other places in the preserve, there is a relatively constant amount of traffic entering the gates. The other 4 gate categories experience wide fluctuations in the traffic flux, while the same is not being observed for the gates (shown by the red strips in the bottom right of the figure). This can be attributed to the nature of how the gates are being used, indicating that roadway works are constantly being carried by a set of ranger vehicles in the preserve. Ranger vehicles that can perform these works might be carrying heavy or loud construction equipment, etc. that might lead to the habitat of the blue pipit being disturbed from their natural rhythm.
Finding #2: Preferred Corridors:
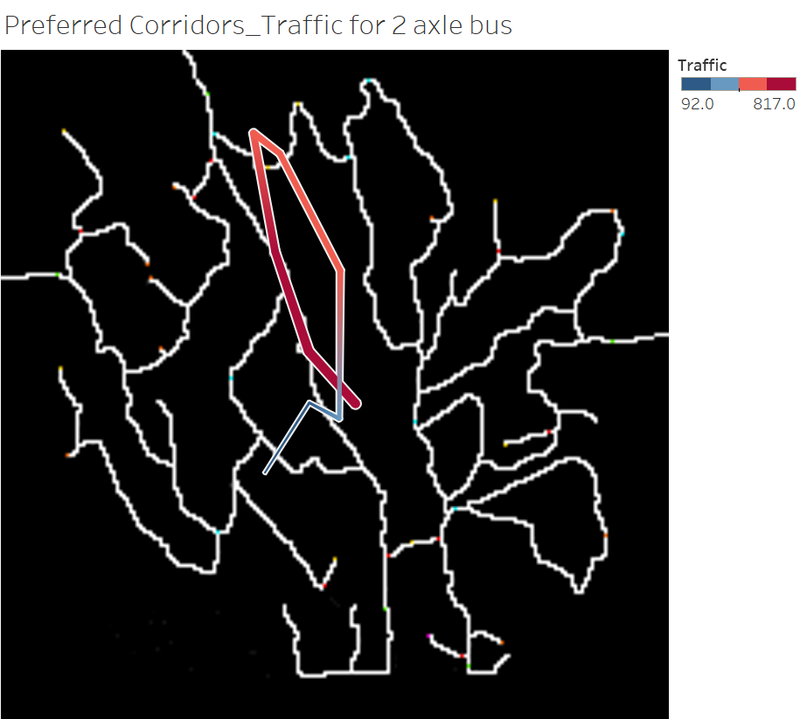
The most used corridors for each car type
The visualisation below helps to understand the common corridors traversed by the different vehicles. This shows over the complete collection of data, which route is being used frequently by all the vehicles. Over a period, it can be visualised on how many of each vehicle type moves through, how fast they move through, and the total time each vehicle spends in each corridor. The corridors that are most used by different vehicles can be inferred, and the results point that the middle section of the preserve, the road connecting camps6- general gate 6- general gate 5- all the way upto ranger stop 0 is a part of the most used vehicle corridor.One exampel is as shown for the 2 axle buses.
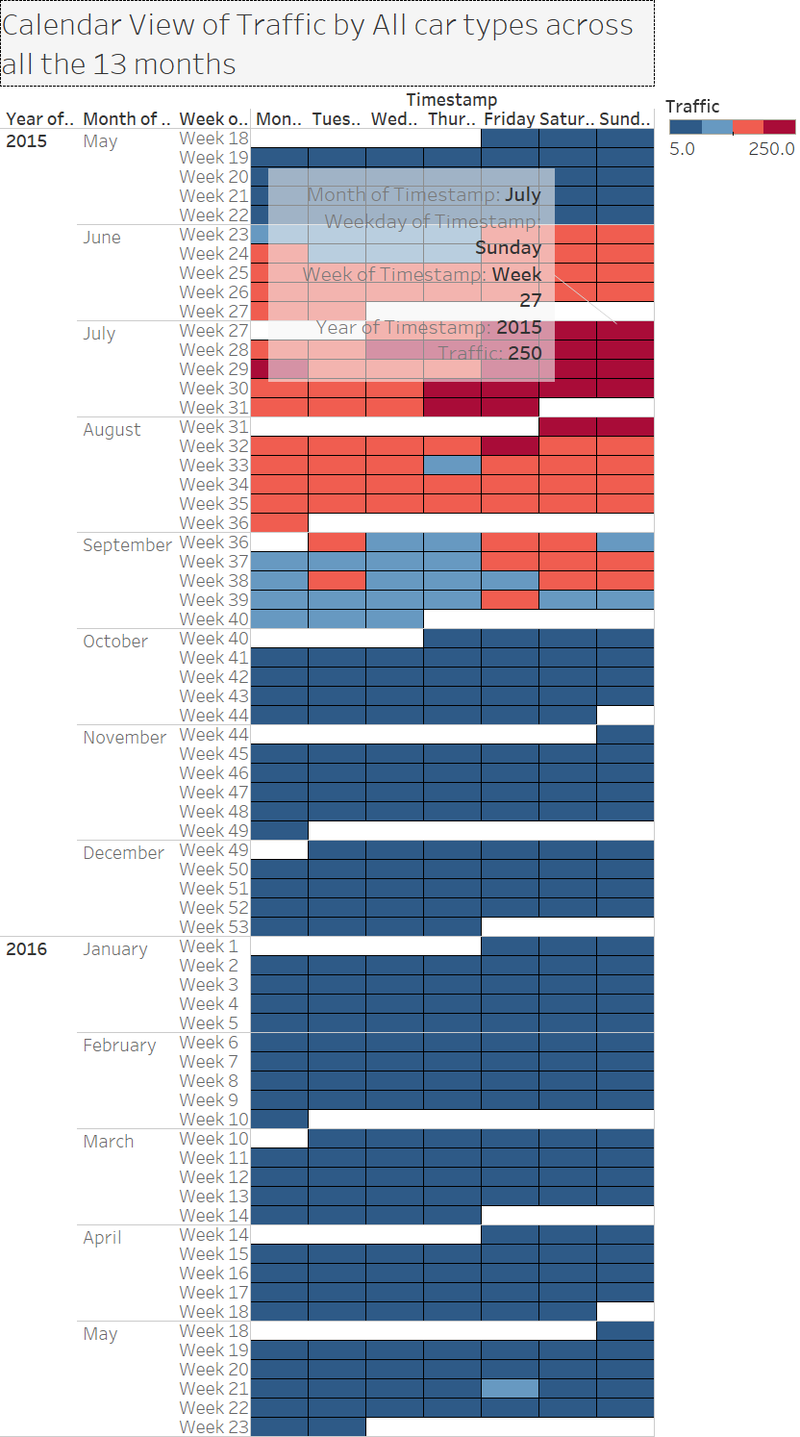
Finding #3: The patterns shows over the entire duration of the analysis, most cars were found in the preserve between 6am to 6 pm on most days from June until September, which might have potentially coincided with the holiday season.
Calendar view of traffic shows spikes in traffic during June to September, with peak in July
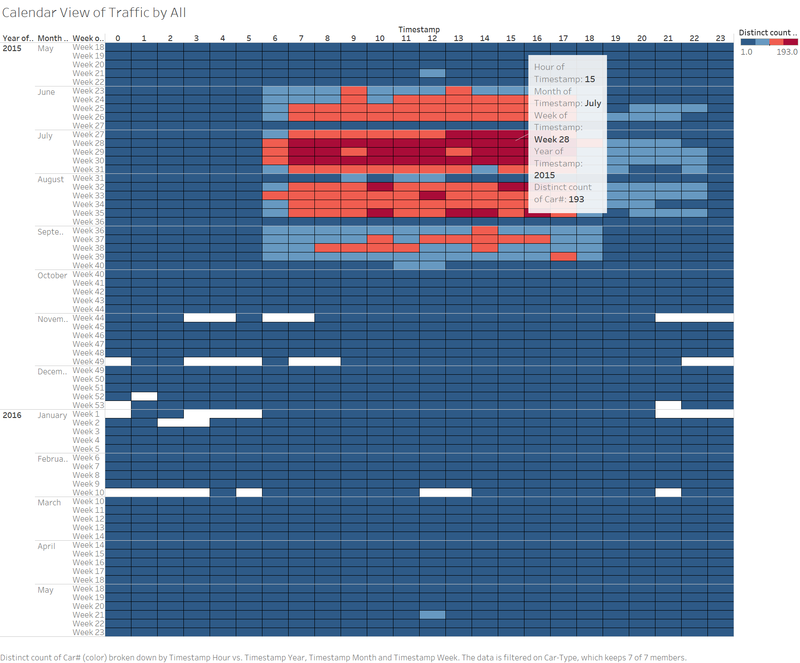
Peak activity is found in the month of July with as much as 193 cars entering from 2pm to 3 pm during the week of 6-12 July 2015, with the peak occurring on the 11th of July 2015.
Calendar view of hourly traffic over the observation period
From the hour by hour visualisation of the traffic in the preserve across the 13 months, a surge is seen during the months of June to September, with a peak in July. The timeframe window also shows that the peak activity time is from 6am to 6pm on a given day. This can
In a similar visualisation as given below, it can be seen that the preserve got its highest amount of footfall in all the 2nd halves of the week in July, which might have coincided with the mating season of the blue pipit!.
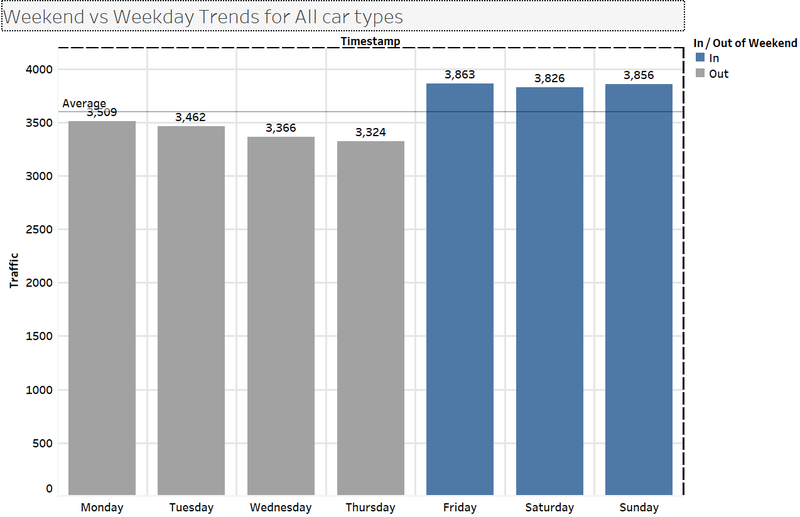
Finding #4: This shows that for all car types, the traffic encountered in the preserve on the weekends- Friday, Saturday and Sunday is relatively higher than that on the other days.
The traffic on weekdays vs weekends
Comparing the traffic patterns by the days of the week, as expected, it is seen that the weekends generally draw more crowds as compared to the weekdays. While individual car type trends vary, this indicates that the three busy days of the preserve mean that all car types are in activity along with the ranger vehicles who follow their fixated work schedule.
Finding #5: The fluctuations in speed across months may be contrary to the traffic trends
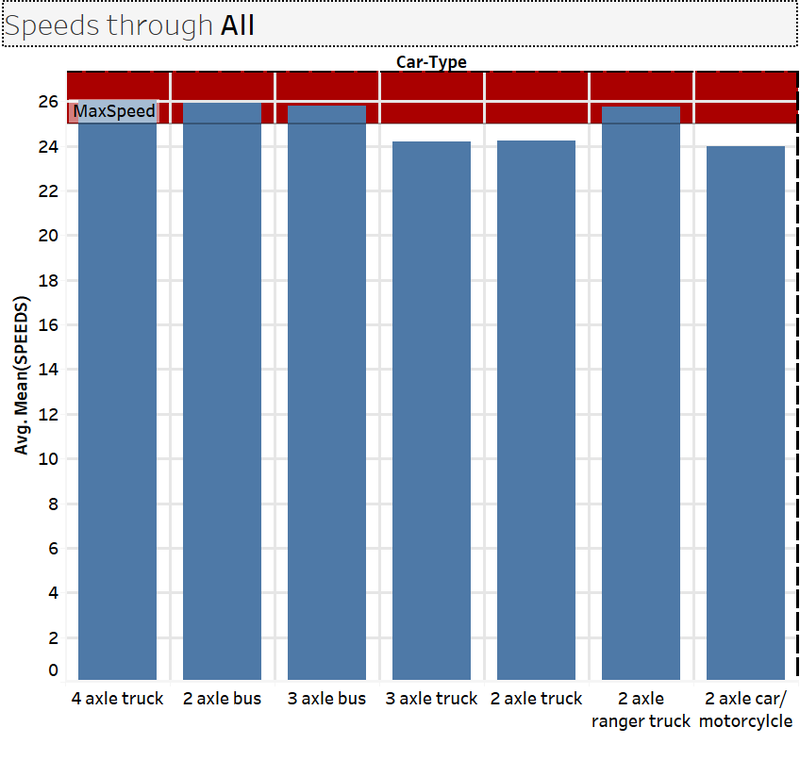
The speeds of various vehicle types and the average they have maintained over the observation period seems higher for certain vehicle types
It is seen that the average speed maintained by the vehicles is different for vehicle types. The average speed of certain vehicles is actually exceeding the recommended speed limit of 25 mph, and this is something that needs to be addressed as vehicles whizzing past the preserve might raise noises and create higher exhausts that might lead to the bird life being affected.
The speeds of various vehicle types and the average they have maintained over the observation period seems higher for certain vehicle types
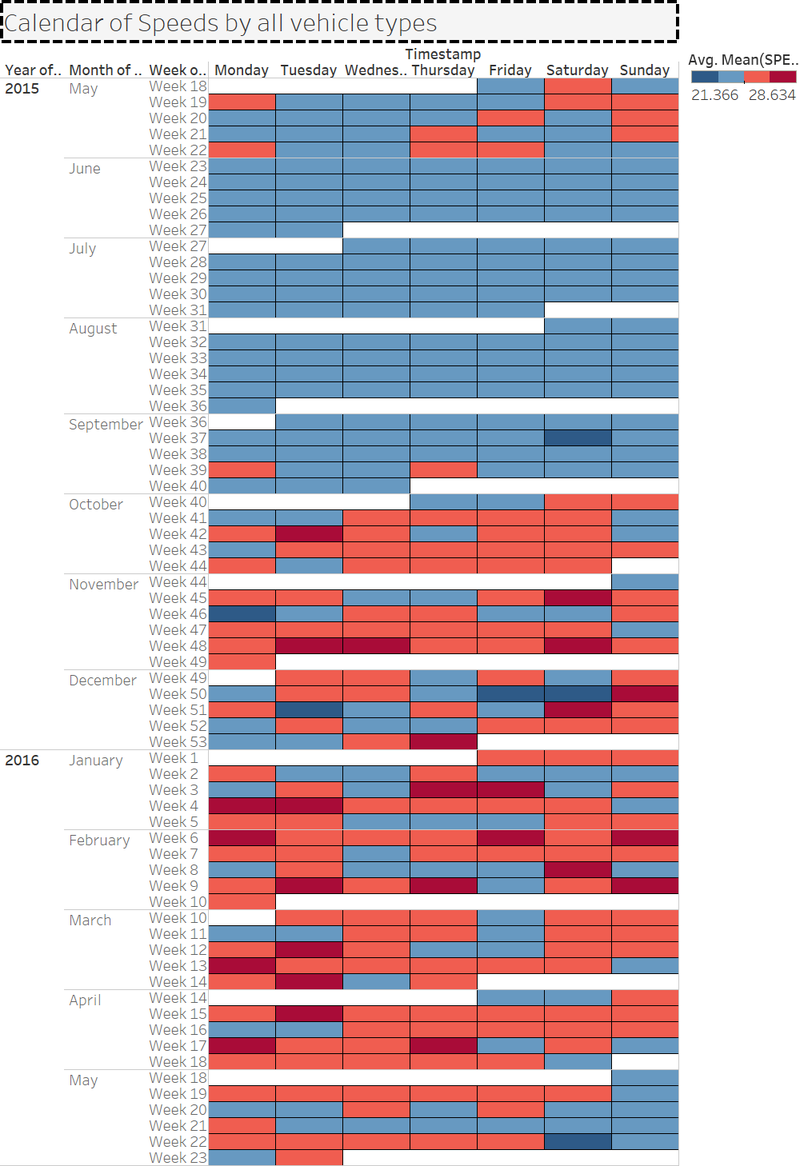
The calendar of speeds shows not much speeding incidents occur in the period between June 2015 to Sep 2015, where the surge in traffic was higher, meaning the roads were probably clogged by vehicles. It gives an additional insight, that when traffic eased out as can be seen in Finding #7 below, the roads became clearer and vehicles had more leeway to move through the preserve faster.
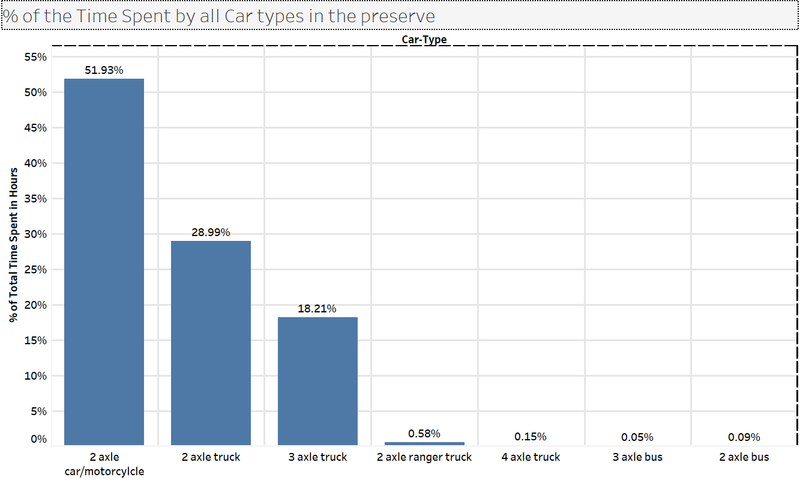
Finding #6: The preserve is most used by the 2 axle cars and motorcycles
The dominance of the 2 axle car or motorcycle int terms of frequent visits and time spent in the preserve
Different car types use the patterns differently. If there is a distinction between cars and motorcycles, it may help to decipher additional insights
Finding #7: Mid-week drop on Thursdays for traffic across the first 4 months, though there is an overall increase.
Cycle plot of the traffic shows that post the peak surge in traffic there is a sharp drop across Nov 2015 to Apr 2016
Post the peak season, there is a steep drop in the traffic influx into the reserve across all gates. It is seen that the period from November 2015 to April 2016 experiences lesser traffic, before it begins to rise again in May 2016. This can be indicative of the preferences of the vehicles in the way they use the preserve. Also, there is mid-week drop in traffic on Thursdays at the camps.
Unusual patterns
Finding #1: The speeding vehicle
20151320031302-558 travels extremely fast (96 mph) between general gate 6 and general gate 5 on the 20th of July 2015. It enters through entrance 4 and exits through entrance 2 in just 18 minutes. The distance between general gate 6 and general gate 5 is being traversed in a minute! It is a 2-axle car/motorcycle.
Finding #2: The loitering vehicle with repeat entries
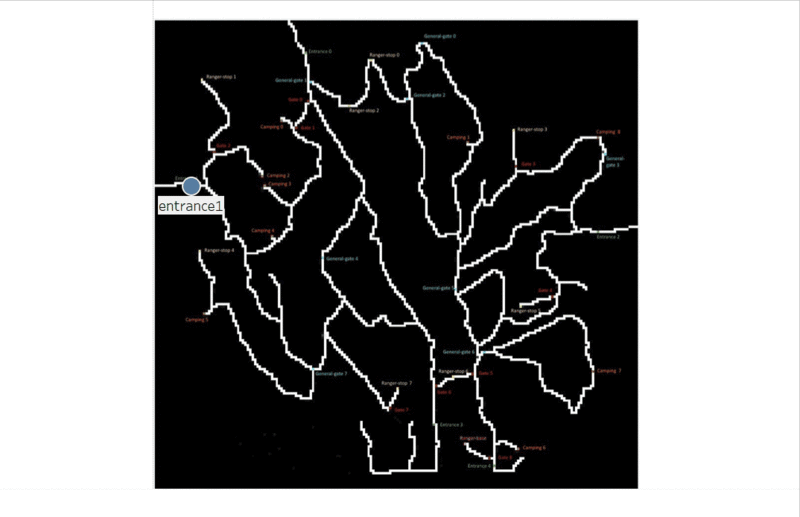
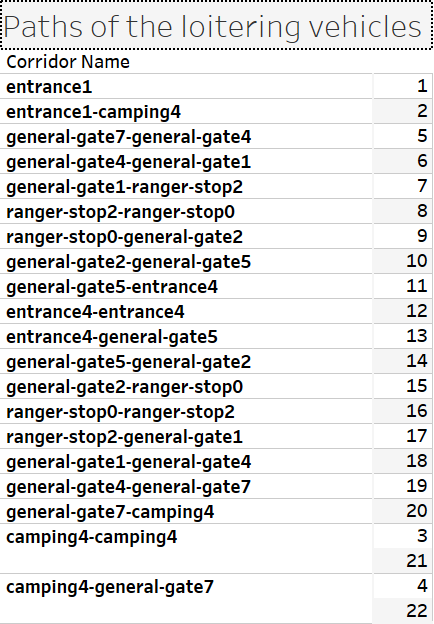
20154519024544-322 is a 2 axle truck that traverses 281 checkpoints in the preserve, the most by any vehicle throughout. The unique fact is that this is not the vehicle that has spent the most time in the preserve, though it is the 2nd highest. The movement of the vehicle is repetitive across the paths underlined below. Can see that the individual path length is only 20, but since the pattern is repeating over time, the vehicle leads to 281 instances of being recorded inside the preserve. The path of the vehicle starts at entrance 1, then keeps looping between camping 4 to entrance 4, then keeps coming back to camping 4. The map of the vehicle movement is as below. It might be a case where the 2 axle truck is familiar with the paths inside the preserve, and is deployed only on Fridays, Sundays and Mondays. This might to be cater to the heavy crowd that generally accumulates on the weekends, as inferred previously.
The vehicle which spends the 2nd highest time, by repeating its entry over various periods, but moving only to specific areas
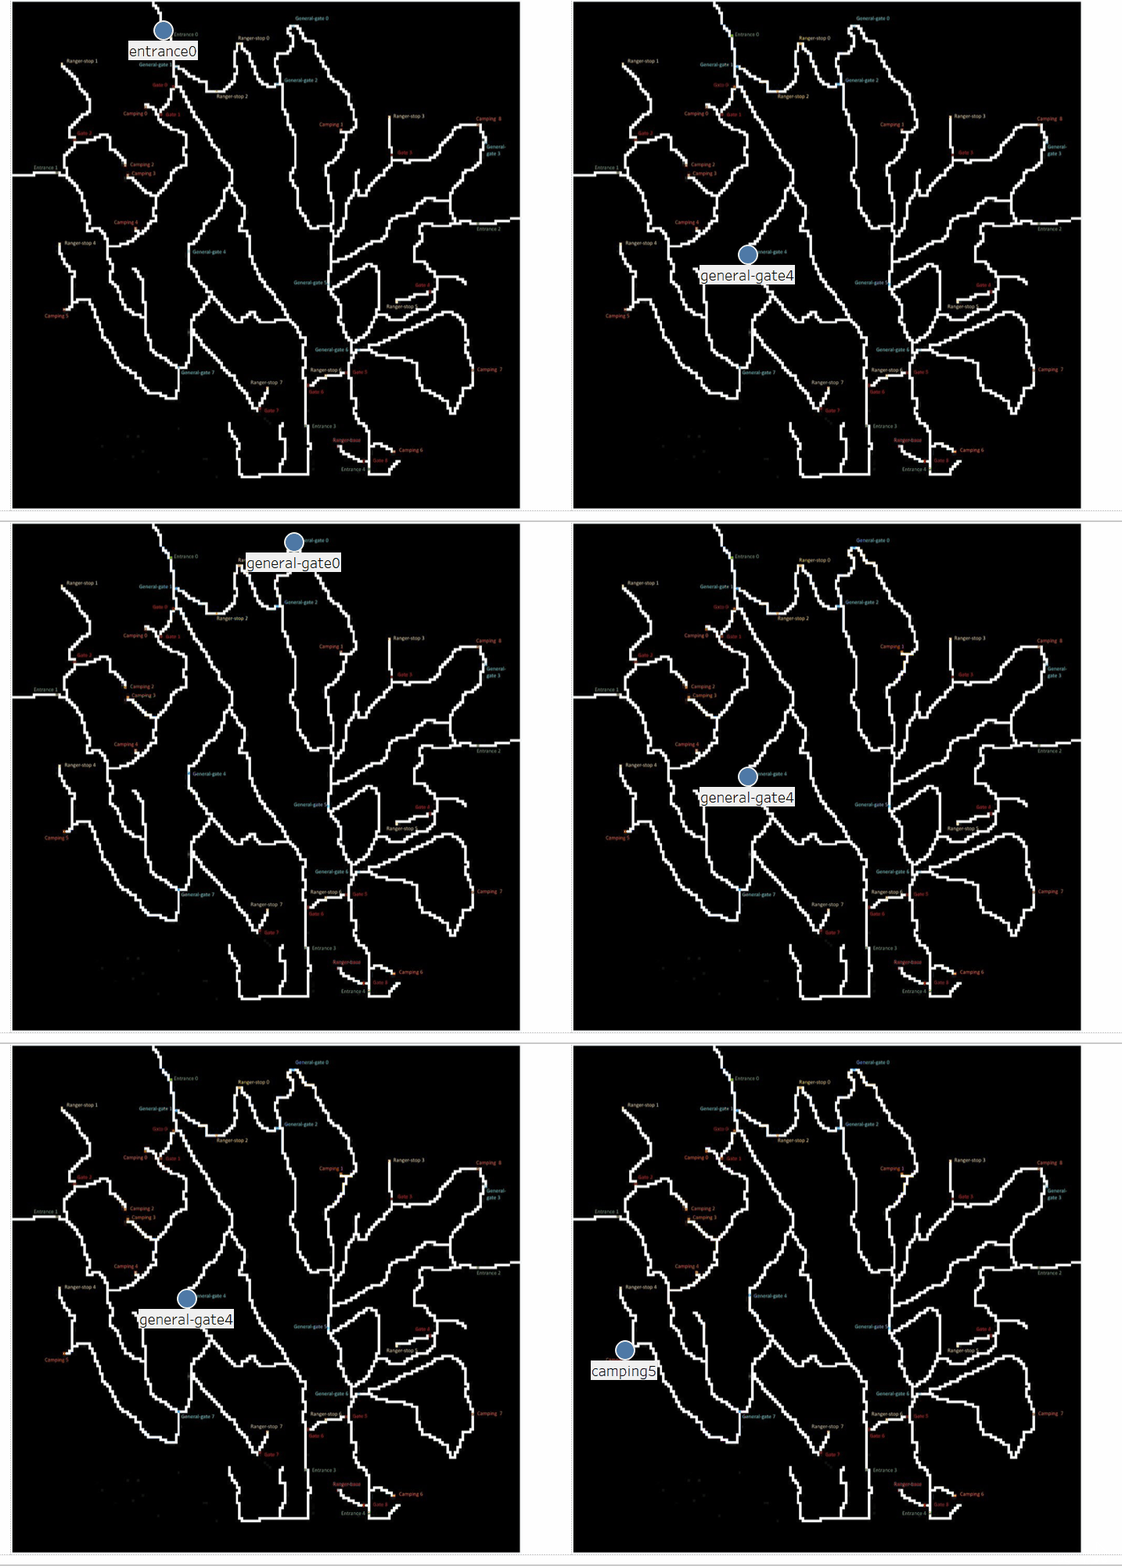
The specific areas this vehicle moves to, begins repeating after a point in time
Finding #3: Encore. Can I visit the preserve again, please?
This is an example of a vehicle which is entering and exiting the preserve multiple times in the time horizon. This also gives it a dubious distinction of being the vehicle to spend the most time in the preserve overall. The repeated movement of this vehicle might be due to the preference people have in visiting the preserve. It is very related to finding #4, where it is found that it is spending most time in the preserve as it is a car which likes to move between camps.
The vehicle which spends the highest time in the preserve,has a preferred corridor in General Gate 1- Ranger Stop 2- Ranger Stop 0 and General Gate 2
The aforementioned corridor is being used the most by a vehicle which is there the most inside the preserve, and it is also inferred that the corridors are flagged in terms of incurring the most traffic.
Finding #4: The camp-hopping vehicle
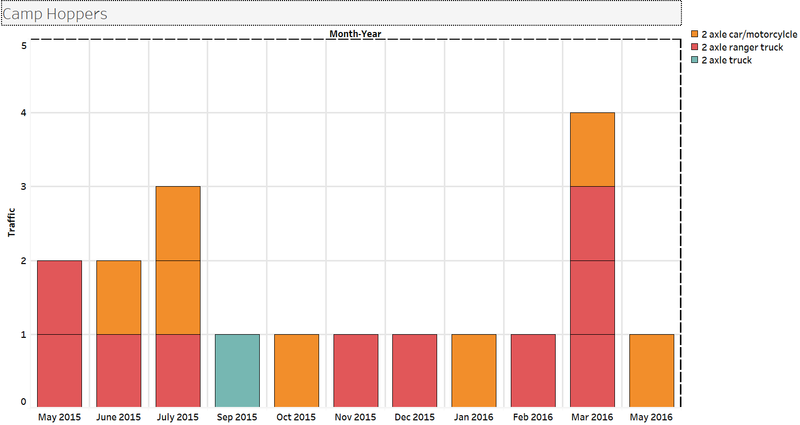
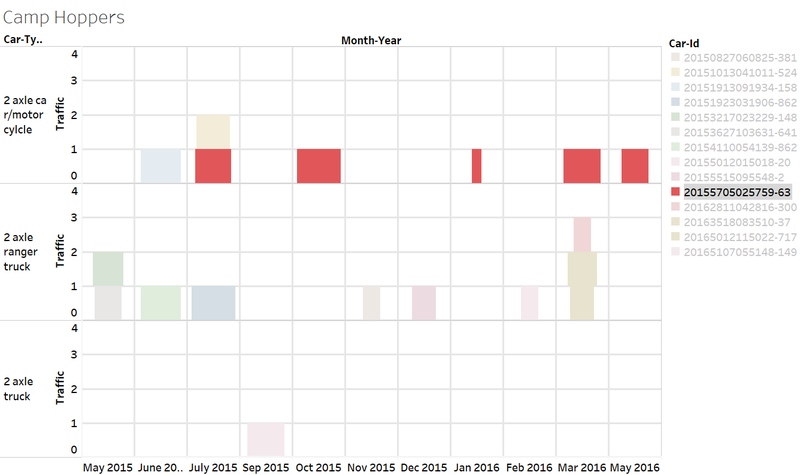
Car #63 identified in finding #3 is also a vehicle which is skipping from camp to camp.
The camp hopping seems to be repeatedly visiting, just like the vehicle identified in finding #1.
The vehicle in finding #3 is also a camp hopper
The camp hopping vehicle seems to be repeatedly visiting, just like the vehicle identified in finding #1.
This vehicle also visits repeatedly to the camps to move between them
Finding #5: 4 axle truck entering the gates.
The paths taken by the various trucks
Zooming in on the 4 axle truck
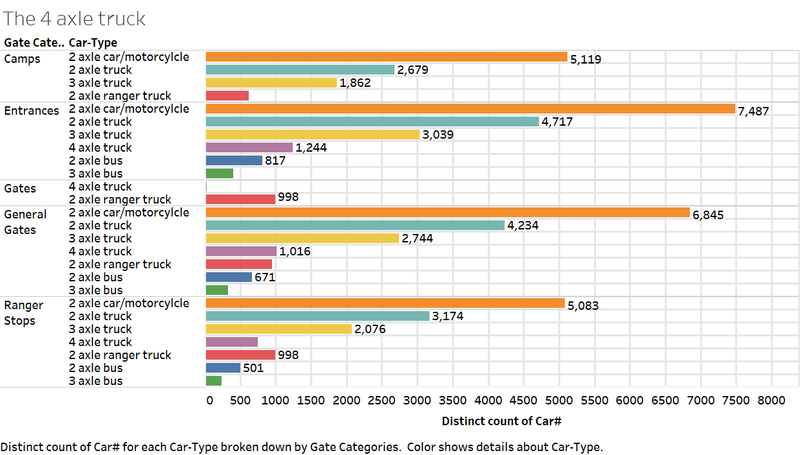
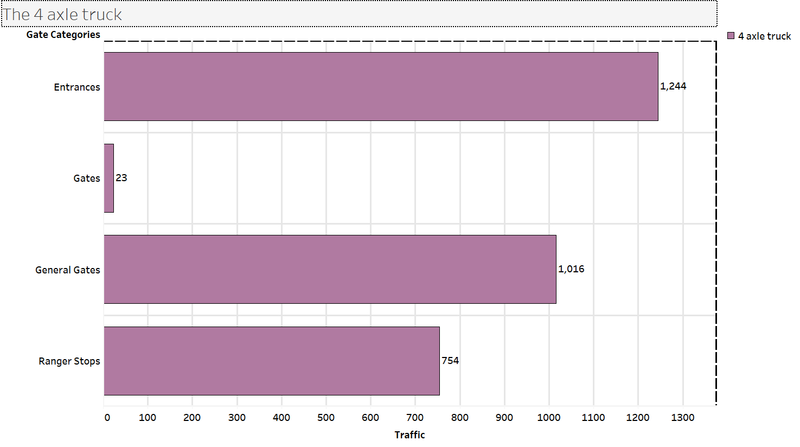
Tracking out the anomaly of the 4-axle truck, which was found in earlier page, it is found that the gates are generally used by the 4 axle trucks and ranger vehicles. The latter is permitted to use it perform roadway works. But, intrusion by 4 axle trucks, which are considered general traffic is not allowed. So, this is a potential anomaly arising out of the movement of the 4 axle trucks in restricted areas!
The path taken by the 4 axle trucks which are found at gates. Totally, 23 in number and found at 2am to 5am on a given day
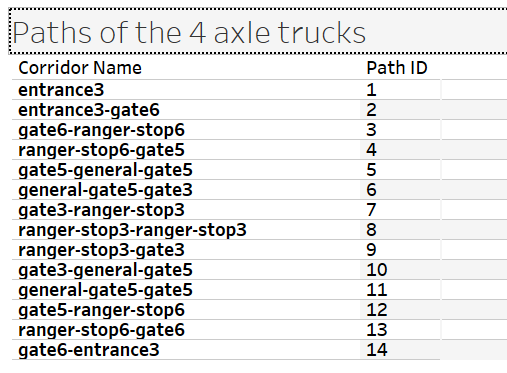
The corridor names of those abnormal 4 axle trucks
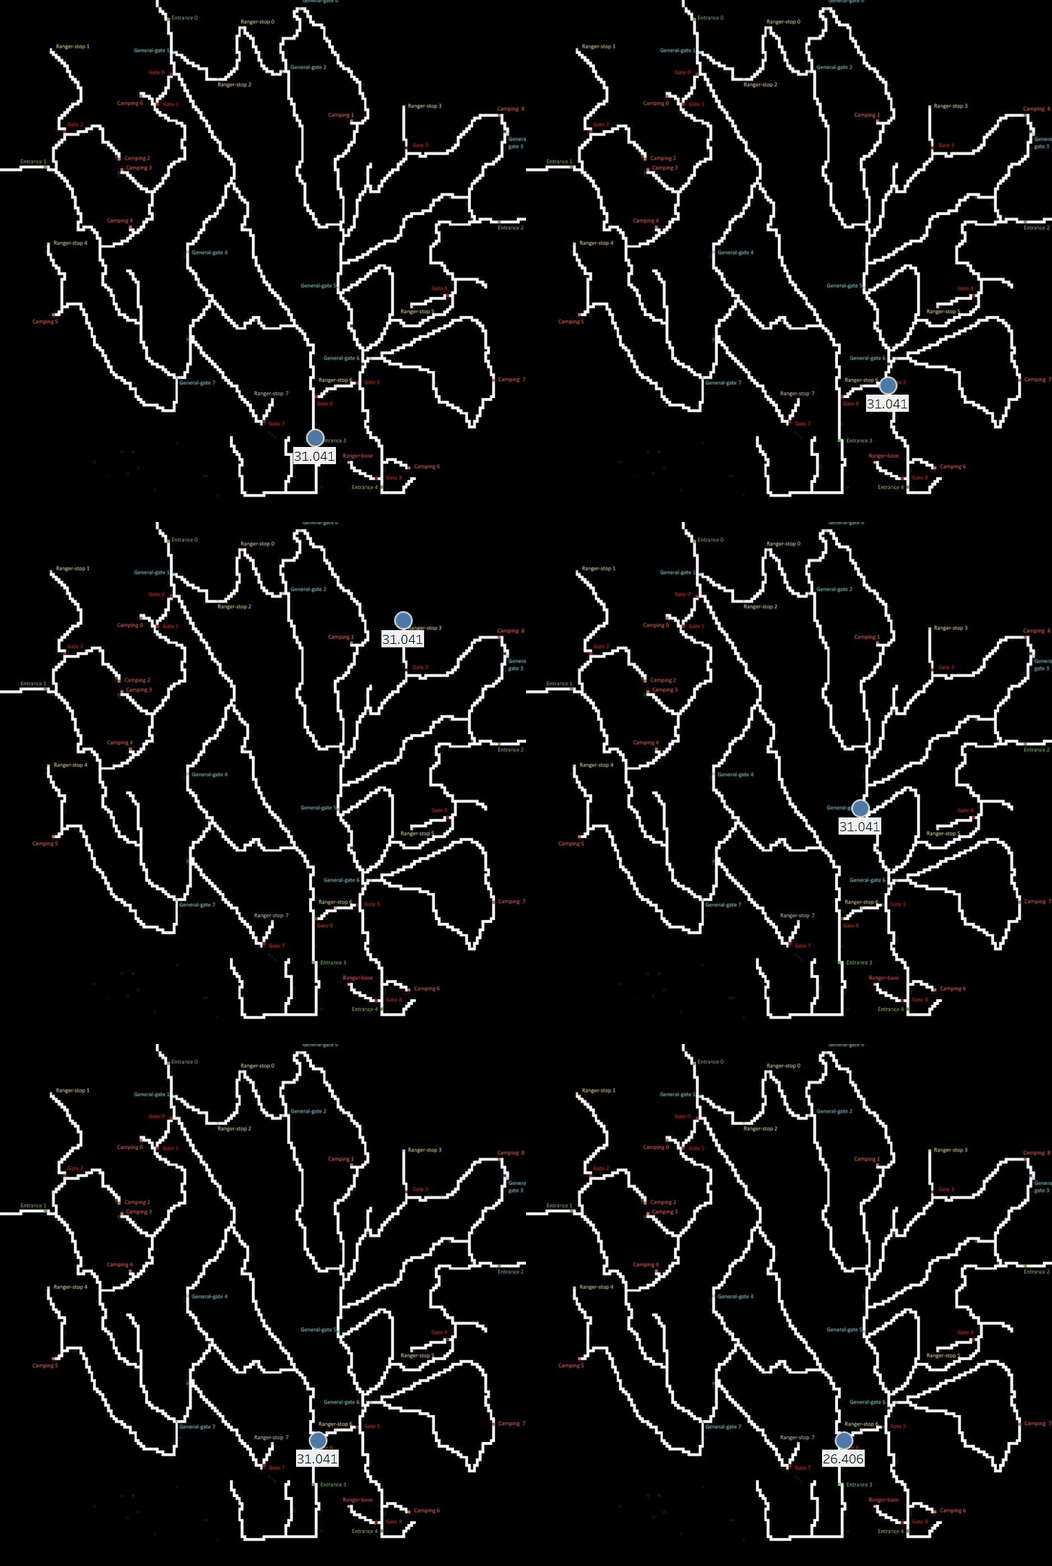
What the 4 axle truck which enters the gates do is that they follow the same specific path across the observation period. It is seen that there are 23 vehicles which do this. The GIF shows the speed annotated for a single vehicle and the path shown on the map. This illustrates that the looping pattern from entrance 3- entrance 3 repeats, and the speed of the 4 axle truck in this path is high. This pattern happens only from 2am to 5am on the given days.
Finding #6: Tailgating the ranger vehicles
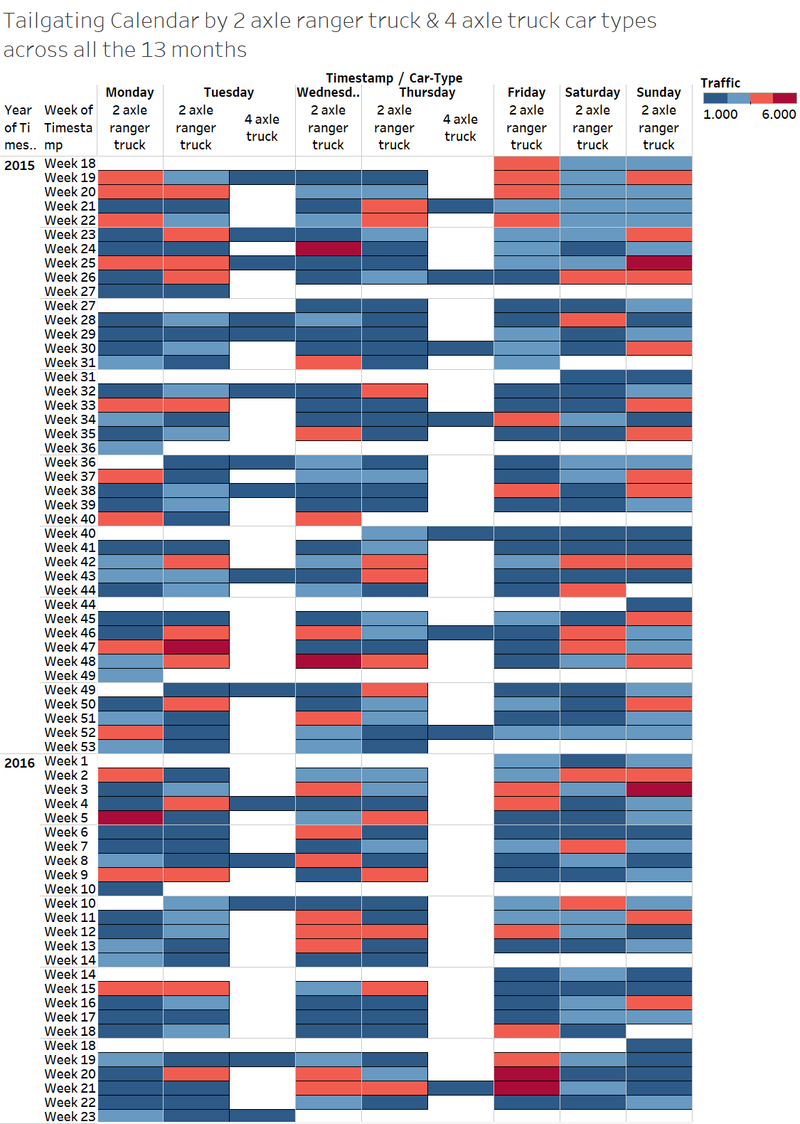
It can be checked whether the 4 axle trucks that enter gates, do so by tailgating the ranger vehicles. Alas! They seem to be doing so, based on the visualisation below, where there is only minimal time difference between the ranger vehicles and the 4 axle trucks. This can mean that the 4 axle trucks are doing this with the help of the ranger vehicles, or dodging the ranger vehicles to move undetected through the gates.
The tailgating calendar to visualise how the 4 axle trucks are trailing the ranger vehicles
The tailgating calendar also shows that this pattern happens exclusively on Tuesdays and Thursdays of a given week.
Finding #7 : Ranger vehicle venturing outside working hours
Are the ranger vehicles stepping out when they are not supposed to be working?
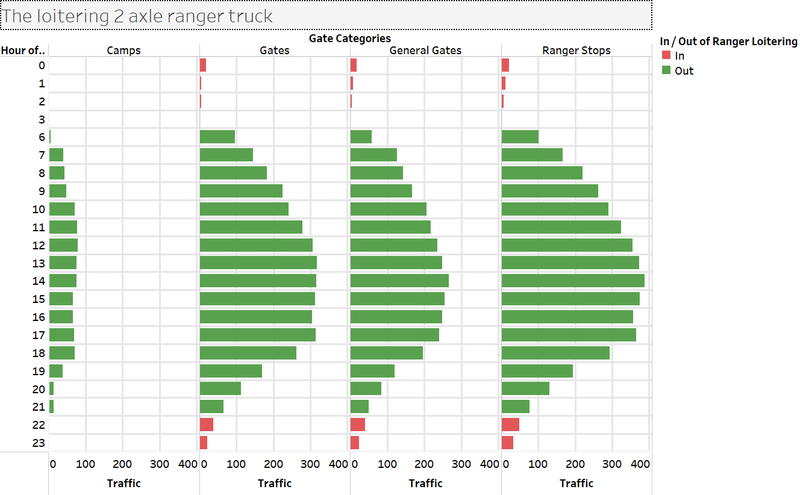
In the visualisation on finding the times when ranger vehicles are found in the preserve, it can be found ranger vehicles are found outside their working hours in the preserve at certain points.
While it is understandable, they will be returning to their ranger bases post work, detecting them move during the time horizon of 10pm to 3 am is rather odd. It can be the following reasons:
- They are venturing out using their access rights to gates at late nights, the real intention for which cannot be identified.
- They are patrolling less during the nights, due to which incidents such as tailgating are happening.
