ISSS608 2016-17 T3 Assign KISHAN BHARADWAJ SHRIDHAR The ground report
The ground report
Patterns of Life Analysis on a daily basis
Reporting from the Lekagul reserve, this is Mitch Vogel, and this page will bring you insights on what exactly happened over the past year.
Analysing patterns of life reveal some interesting patterns as covered in the report below. The scope of this page covers analysis that can explain the behaviour of vehicles that travelled through/within the park. It will cover an overview of the types of vehicles, the places they frequent (marked in terms of gate groups such as Camps, Entrances, etc. or individual gates). Adding the temporal dimension will yield trends based on the individual times of a day, or a common everyday pattern, that is worthy of observation.
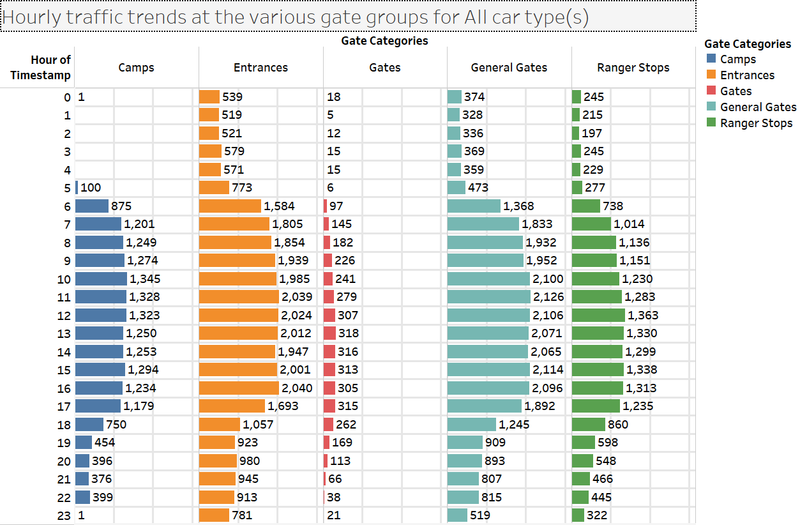
Finding #1: No movement inside camps and gates at Silent Hours?
No traffic at entry the camping site entrances and the gates at the preserve during specific times
From the hourly trends of traffic at the various gate groups, it can be seen there are virtually not much traffic being captured in the preserve from 11 pm to 4am (+1 day) at the Camps and Gates. The behaviour is across all car types such as 2-axle truck, 3-axle truck, etc. One plausible explanation can be that camps might be closed for vehicle movement once night campers have settled in, and may be unsafe to venture near camping zones, due to other wildlife movement in the preserve. Gates, which are mainly used for inspection and carrying out road works, also do not see vehicle flow during these hours. The other parts of the preserve during this time, however see traffic influx, albeit in relatively lesser amounts. This however does not necessarily mean that cars are not present inside camps during the 11pm to 4am duration.
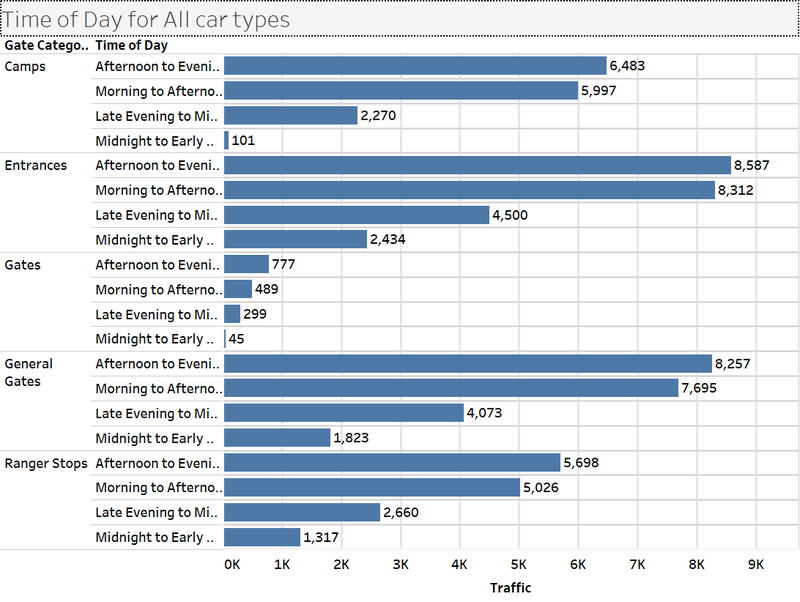
The visualisation below says that ‘afternoon to evening (i.e. 12pm to 6pm on a given day) is the time range when most traffic from all vehicle types can be spotted in the preserve.
Traffic trends by time of day
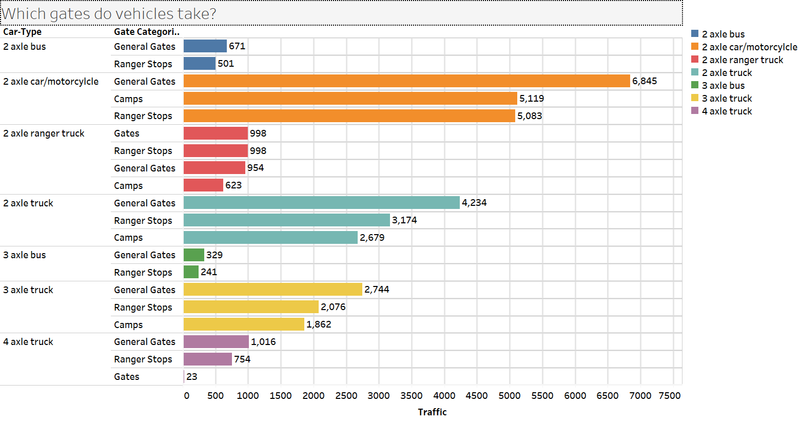
Finding #2: 2axle buses, 3 axle buses and 4 axle trucks do not enter camps at all.
Which paths do vehicles take?
The above plot helps to decipher that 2 axles buses, 3 axle buses and 4 axle trucks do not enter camps at all. The entrances have not been considered, as they are common points for all vehicle types (except the ranger vehicles). There is an anomaly being spotted here, which is that 4 axle trucks are found to be present at Gates, the discussion about which can be found later.
The table of the preferred paths taken by different vehicle types are shown below:
|
S/N |
Vehicle Type |
Typical Regions Visited |
|
1 |
2-axle bus |
General Gates-Ranger Stops |
|
2 |
2-axle car/motorcycle |
General Gates- Ranger Stops-Camps |
|
3 |
2 axle ranger truck (2P) |
General Gates- Ranger Stops- Camps-Gates |
|
4 |
2 axle truck |
General Gates- Ranger Stops-Camps |
|
5 |
3 axle bus |
General Gates- Ranger Stops |
|
6 |
3 axle truck |
General Gates- Ranger Stops-Camps |
|
7 |
4 axle truck |
General Gates- Ranger Stops-Gates |
[*Not to be read in time wise order.]
[**Entrances are the typical first gate categories for all vehicle types except ranger vehicles.]
Finding #3: The car types identified in Finding #2 have smaller times, but as a result, they tend to move through paths with higher speeds.
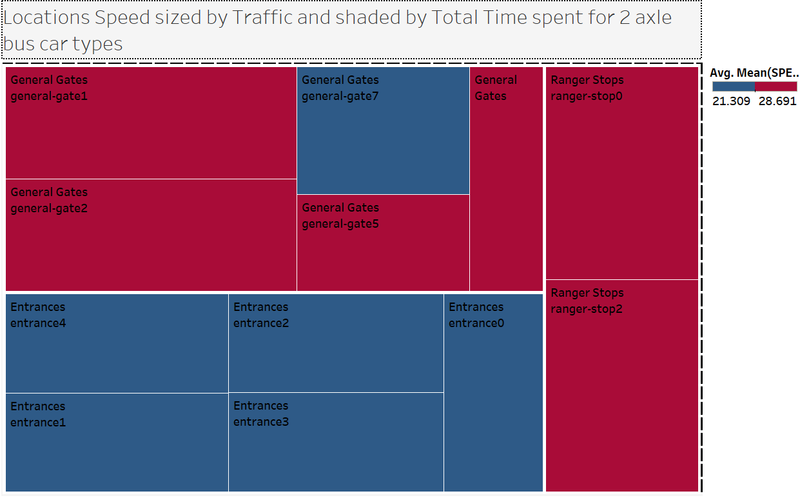
The speed profile of the vehicle types
The visualisation of the average speeds (in mph) shows that cars that tend to spend lesser time in the preserve, i.e. the 3 categories identified in finding 1, maintain a higher than average speed while traversing through the preserve. Once they are past the entrance, their average speed across the various areas they pass through is greater than the maximum speed limit of 25 mph (indicated by the red zones). This indicates that these car types might be frequently creating noises that disturb the calmness of the surrounding, and thereby scaring the pipit away. The behavior is similar for the 3 car types identified in finding #2, and another anomaly arising is that the 4 axle trucks who are trespassing gates, also do so at higher speed.
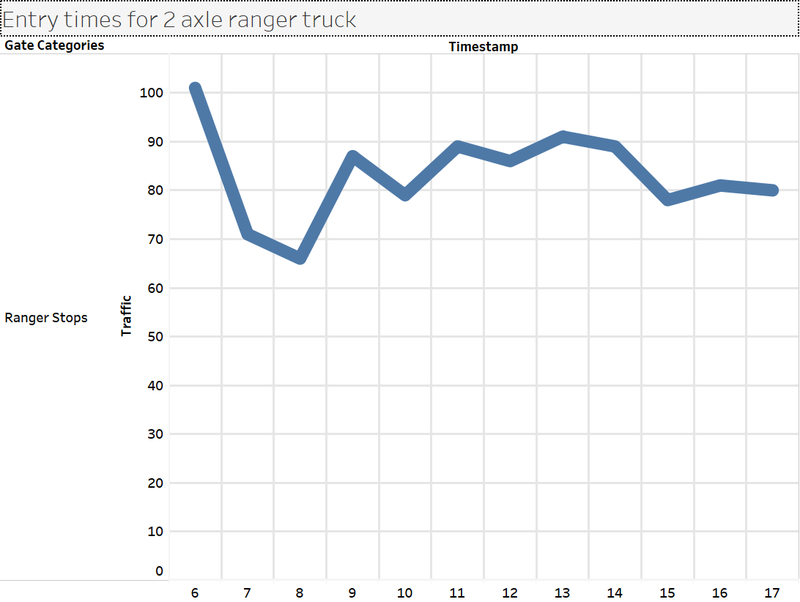
Finding #4: The ranger vehicles begin moving from 6AM to 5PM on a typical day.
When do ranger vehicles begin operating?
The visual shows that the entry of ranger vehicles happen from 6AM to 5PM on a given day. This may be indicative of their working hours, during which the rangers are in duty across the preserve. Given the preserve does not follow daylight saving hours, this is an active explanation to why the rangers might want to harness all the light that is available to patrol and monitor the preserve. But, for all other vehicle types, since they are free to enter and exit at various times, the below trends are observed. For e.g. the 2 axle buses shows that they are quite active right throughout the day, across all the locations of the preserve.
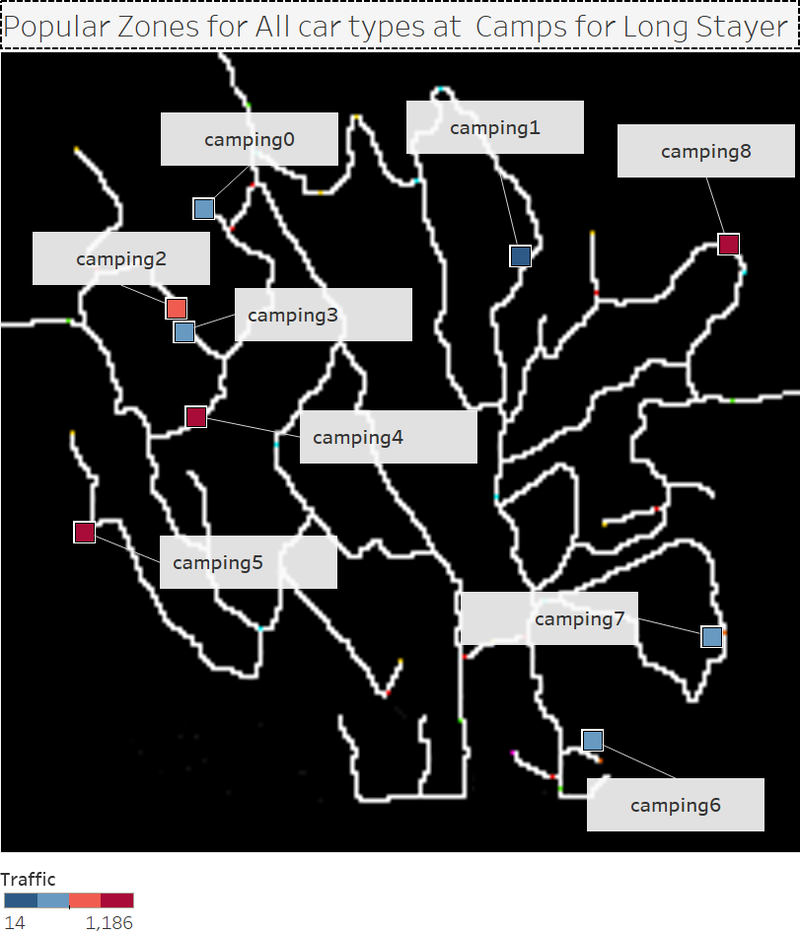
Finding #5: People who camp as long stayers, i.e. tend to stay more than 24 hours inside the preserve, have a preference towards camps 4, camps 5 and camps 8.
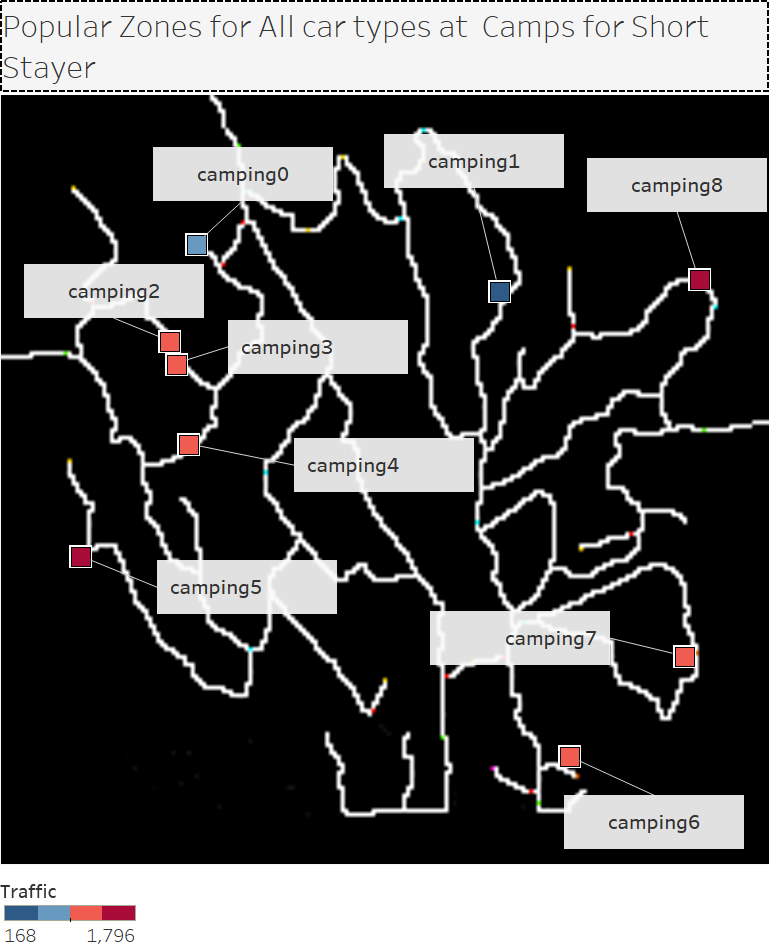
People who wish to stay for a short while also tend to use camps 5 and 8 more.
Traffic encountered at popular camps due to long stayers
Traffic encountered at popular camps due to short stayers
The visualization illustrates that the traffic encountered in the camps is seen the highest inside camps 8 and camps 5, meaning that whenever people decide to camp, there is higher tendency to prefer these camps.
This might be an indication of the popularity of the attractions within the camp, with more things to explore and better facilities, etc. The diametrically opposite location of the two popular camps shows that there will be frequent movement in both the top-down as well as the right-left (lateral) directions, leading to frequent disturbances for the Pipit. The next finding focuses on the problem of the people spending more time at a single place.
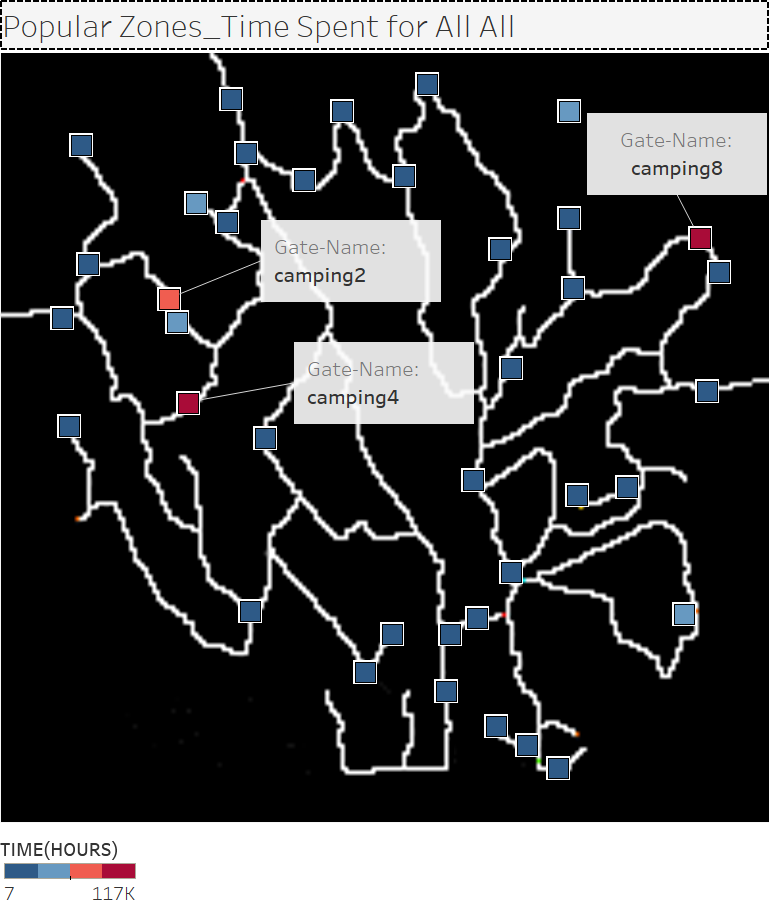
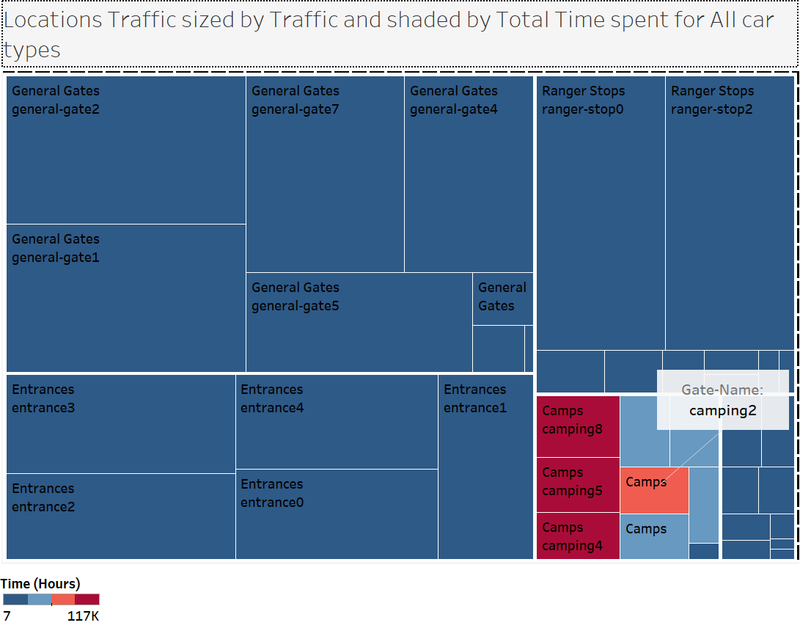
Finding #6: In terms of the total time spent at a place, camping 8, camping 2 and camping 4 are the most popular locations.
Camps are hotspots of activity as compared to all other locations in the preserve. The visual shows which exactly are those hotspots
While camping 8 experiences most traffic in the preserve, it is also found that the time people spend inside camping 8 is also the highest.
It must be noted that the number of vehicles entering a camp does not necessarily mean they would stay there. Hence the data in finding #5 and finding #6 will help to understand the temporal and spatial flow in terms of traffic density as well as time flow. The heatmap below helps to understand both patterns under a single visualisation.
Heatmap showing both locations traffic and the time people spend inside them
