ISSS608 2016-17 T3 Assign HE LINGFEI - Data Preparation
|
|
|
|
|
|
|
| CONTENT |
|---|
|
1. Data Description |
1. Data Description
1.1. Source of Dataset
The dataset is downloaded from: VAST Challenge 2017: Mini-Challenge 1
1.2. Data Overview
1.2.1. Lekagul Sensor Data.csv - Traffic Movement Data
There are five types of sensors recording data.
- Entrances. All vehicles pass through an Entrance when entering or leaving the Preserve.
- General-gates. All vehicles may pass through these gates. These sensors provide valuable information for the Preserve Rangers trying to understand the flow of traffic through the Preserve.
- Gates. These are gates that prevent general traffic from passing. Preserve Ranger vehicles have tags that allow them to pass through these gates to inspect or perform work on the roadway beyond.
- Ranger-stops. These sensors represent working areas for the Rangers, so you will often see a Ranger-stop sensor at the end of a road managed by a Gate. Some Ranger-stops are in other locations however, so these sensors record all traffic passing by.
- Camping. These sensors record visitors to the Preserve camping areas. Visitors pass by these entering and exiting a campground.
1.2.2. Preserve Map
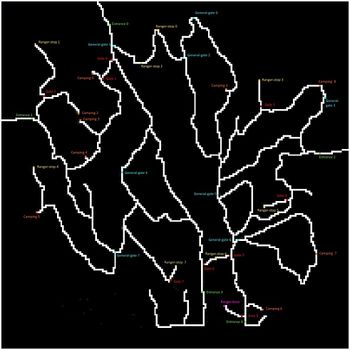
The contractors working with the Nature Preserve rangers have provided a map that presents the Preserve in terms of a 200x200 gridded area. The grid is oriented with north at the top of the map. Grid location (0,0) is at the lower left corner of the map (the SW corner). They have superimposed both the roadways and the sensor locations on this grid. The map shows an area 12 miles x 12 miles. Roadways are indicated by white colored pixels on the map. Each sensor type has its own unique color: Entrances (green), General-gates (blue), Gates (red), Ranger-stops (yellow), and Camping (orange).
1.2.3. Other Information of The Data
- Traffic either passes through the Preserve, stay as day campers, or stay as extended campers.
- Preserve Rangers stay at the ranger-base toward the southeast of the Preserve when they are not working in the Preserve.
- The speed limit through the Preserve is 25 mph.
- The Preserve area does not observe “Daylight Savings Time”.
- The roadways traveling southward from Entrances 3 and 4 do continue to other roadways outside of the Preserve area, but these are not shown on the map. Vehicle data will not reflect travel beyond the Preserve in this direction.
2. Data Preparation
2.1 Travel Sequence & Path & Complete Route
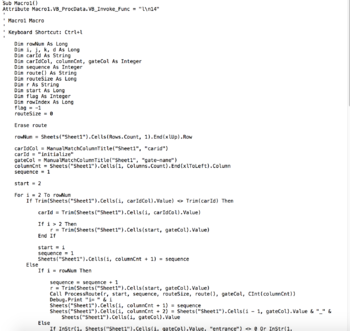
A Excel VBA code is written to calculate:
- The movement sequence which is used to plot the path in Tableau.
- Partial path for each movement.
- The complete route which ranger vehicle starts and ends at the ranger-base and other vehicles starts and ends at entrance.
Below is the snippet of the Macro:
2.2 Sensor Position Coordinates Matching
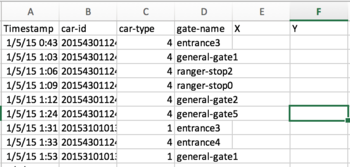
X, Y Coordinates are necessary when doing map data visualization and analytics. The given dataset does not contains coordinates for every sensor. Therefore, the map coordinate are manually mapped in following steps:
- Step 1. Add Two Empty Columns X, Y to the Original Data Table
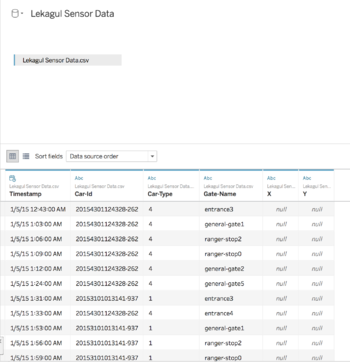
- Step 2. Import Data Source into Tableau
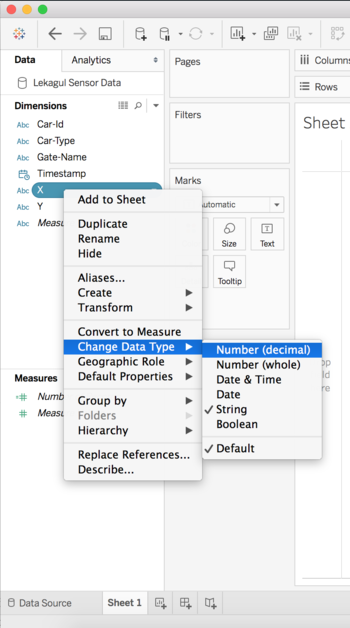
- Step 3. Change Data Type for X and Y from String to Number
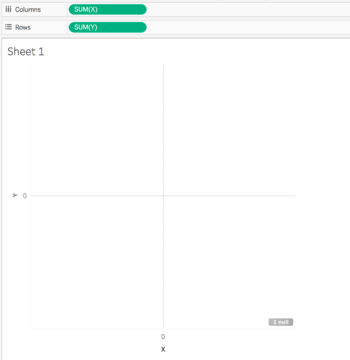
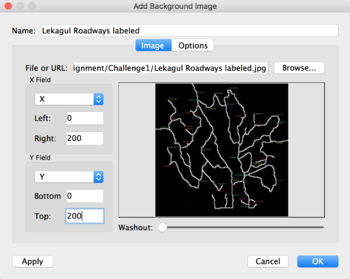
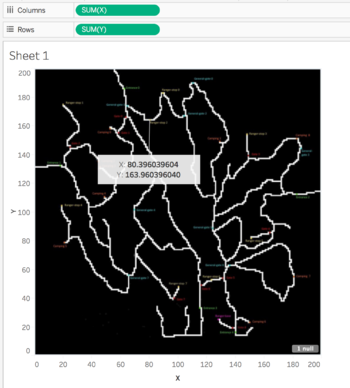
- Step 4. Drag and drop X into Column, Y into Row and Import The Preserve Map
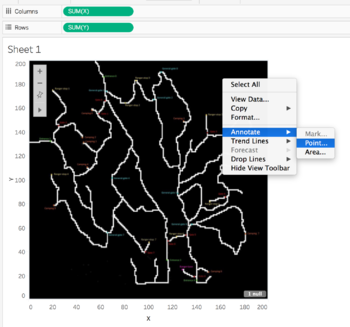
- Step 5. Right Click on The Map and Select Annotate -> Point, e.g. The coordinates for ranger-stop2 is X:80.396039604, Y:163.960396040
Coordinates for every gate is mapped using step 5, and the finished coordinates mapping with gate-name file is as below:


