ISSS608 2016-17 T1 Assign3 Agrim Gairola
ISSS608 2016-17 T1 Assign1_Agrim Gairola
MAYHEM AT DINOFUN WORLD
Overview
DinoFun World is a typical modest-sized amusement park, sitting on about 215 hectares and hosting thousands of visitors each day. It has a small town feel, but it is well known for its exciting rides and events.
One event last year was a weekend tribute to Scott Jones, internationally renowned football (“soccer,” in US terminology) star. Scott Jones is from a town nearby DinoFun World. He was a classic hometown hero, with thousands of fans who cheered his success as if he were a beloved family member. To celebrate his years of stardom in international play, DinoFun World declared “Scott Jones Weekend”, where Scott was scheduled to appear in two stage shows each on Friday, Saturday, and Sunday to talk about his life and career. In addition, a show of memorabilia related to his illustrious career would be displayed in the park’s Pavilion. However, the event did not go as planned. Scott’s weekend was marred by crime and mayhem perpetrated by a poor, misguided and disgruntled figure from Scott’s past.
The Task
You have access to the in-app communication data over the three days of the Scott Jones celebration. This includes communications between the paying park visitors, as well as communications between the visitors and park services. In addition, the data also contains records indicating if and when the user sent a text to an external party.
Task1: Use visual analytics to analyze the available data and develop responses to the questions below.
a.Identify those IDs that stand out for their large volumes of communication.
b.For each of these IDs Characterize the communication patterns you see.
c.Based on these patterns, what do you hypothesize about these IDs?
Task2: Describe up to 10 communications patterns in the data. Characterize who is communicating, with whom, when and where. If you have more than 10 patterns to report, please prioritize those patterns that are most likely to relate to the crime
Task3: From this data, can you hypothesize when the vandalism was discovered? Describe your rationale. Note: Please limit your response to no more than 3 images and 300 words.
Tools Used
- Tableau version 10.0
- JMP Pro
- Gephi
- Microsoft Office
Explorations
Task 1
a. Identification of IDs with Large communication
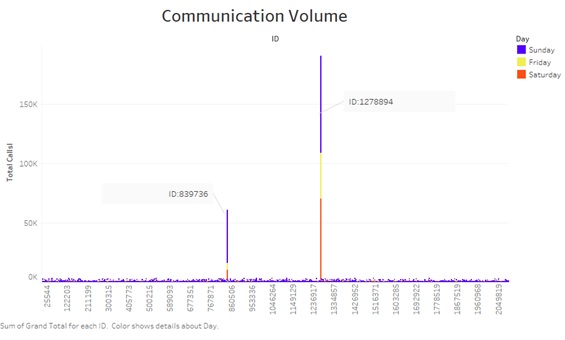
In order to analyse the IDs that have made the largest amount of communication, we plot a chart between IDs and total outgoing calls made. It can be clearly seen that 2 IDs in specific make excessively large number of calls. These IDs are 1278894 and 839736.
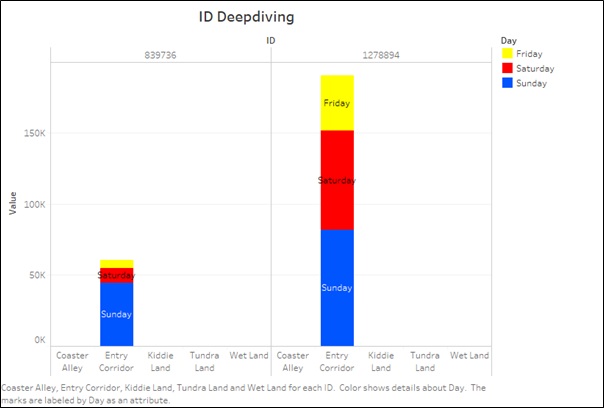
In order to understand the location of these two IDs and where these calls were made from, Let us deep dive into these IDs.
It is clear from the graph below that these IDs are not moving and are making all their communication from the Entry Corridor. This is strange since any visitor to the park would communicate throughout the park.
b. Communication Patterns
In order to analyse the communication patterns of these IDs, we can make use of the Tools Gephi. To prepare the provided data for Gephi, we make the following changes to the database:
- Combine the data for all 3 days with the frequency of repeated calls being captired at "weight"
- Replace "from" with "Source" and "to" with "Target"
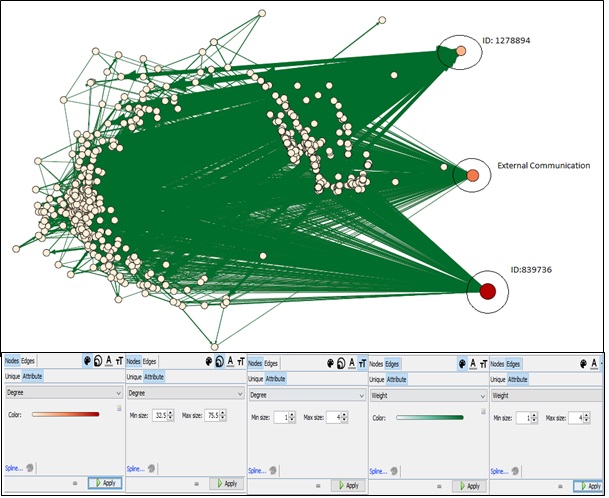
On importing the data into Gephi, the following network can be seen using the settings as shown below:
From the network diagram, it is clear that there are three nodes that are participating in maximum volume of communication. Two of these nodes represent the IDs that were discovered previously. The third node represents all the communication that was made to external parties. ID 1278894 and 8398736 both are communicating with a large volume of park visitors. Additionally it is interesting to note that these IDs do not communicate with each other, neither do they have any external communication.
Closely observing the network we notice that communication data of ID 839736 is significantly higher than 1278894. Additionally 839736 has similar volume of incoming and outgoing data while ID 1278894 has large volume of Incoming Data.
c.ID Hypothesis
From the above visualizations, we have the following information:
- Communication Volume of ID 1278894 and 839736 is significantly higher that other park visitors.
- All communication made by the IDs is from Entry Corridors.
- These IDs communicate to almost all other IDs present in the park.
- These IDs do not communicate with each other. Neither do they communicate with any external party.
- ID 839736 has a large amount of to and fro communication multiple times(upto 60 times with a single visitor)
- ID 1278894 has most of its volume is incoming communication.
Hypothesis
It is safe to assume that both these IDs are not park visitors. These are most likely employees of the park who have very specific task of communicating with the park visitors.
ID 1278894: This ID appears to a park employee who is responsible to handling the queries of the park visitors. A large volume of incoming communication indicates that this ID is receiving constant queries from park visitors.
ID 839736: This ID is most likely an automated communication service where sends out communication to visitors and the visitors respond to it. Considering the frequency of the communication of this ID with other IDs is very high, it is most likely a messaging service.
=Task 3=
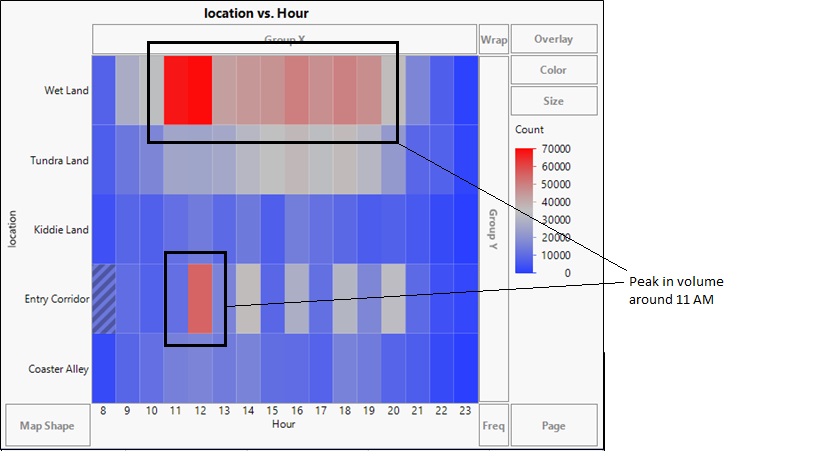
This task involves discovery of the time of the vandalism.The communication data can be used to discover the time and location of the vandalism. It is safe to assume that the communication will see a peak in its volume after the Vandalism happens.
The heatmap depicts the volume of communication with respect to time for various locations. It can be seen that there is a intense peak in the communication in the wetland area between 11 AM to 12 PM. The heat map also shows us soon after the communication peaks in the Wetland, we see a rise in the volume of communication in the Entry Corridor. This could be the park park visitors trying to contact the park helpdesk to report vandalism or seek assistance.


