ISSS608 2016-17 T1 Assign1 Agrim Gairola
ISSS608 2016-17 T1 Assign1_Agrim Gairola
Contents
Abstract
The project involves understanding the trends in resale public housing supply in Singapore. In order to decipher the trends, we need to analyse the factors that effect the sales volume and the prices of public housing. These factors may include geographic locations, number of stories, floor area type of house etc.
Problem
: This assignment aims finding answers to several interesting questions such as -
- Is there a relationship between sales and number of stories? .
- Is there a relation between Prices and floor area?.
- Are there certain type of houses that Singaporeans prefer?.
- Are there some areas more popular than others?
- Are there some trends that can be noted on comparing 2015 and 2016 data
Tools Used
- Tableau version 10.0
- Microsoft Office
Motivation
This project provides an insight into the real estate market and helps me in understanding the spending patterns of Singaporeans. The assignment brings me closer to the Singaporean culture while helping me get acquainted to basics of Tableau.
2015 VS 2016 TRENDS
Approaches
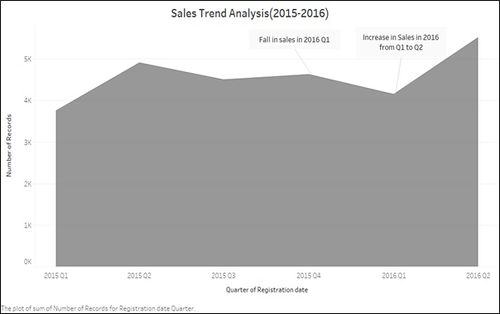
- Sales trend:In order to analyse the sales trends, we plot a area chart indicating sales quarter by quarter for 2015 and first half of 2016
- Understanding the data:On analysis of the trend, we notice that the sales peak during the second quarter of 2015 as well as 2016. On a more general note, we also notice that the end of 2015 saw a fall in the sales of flats. However, 2016 saw an increase in the sales.
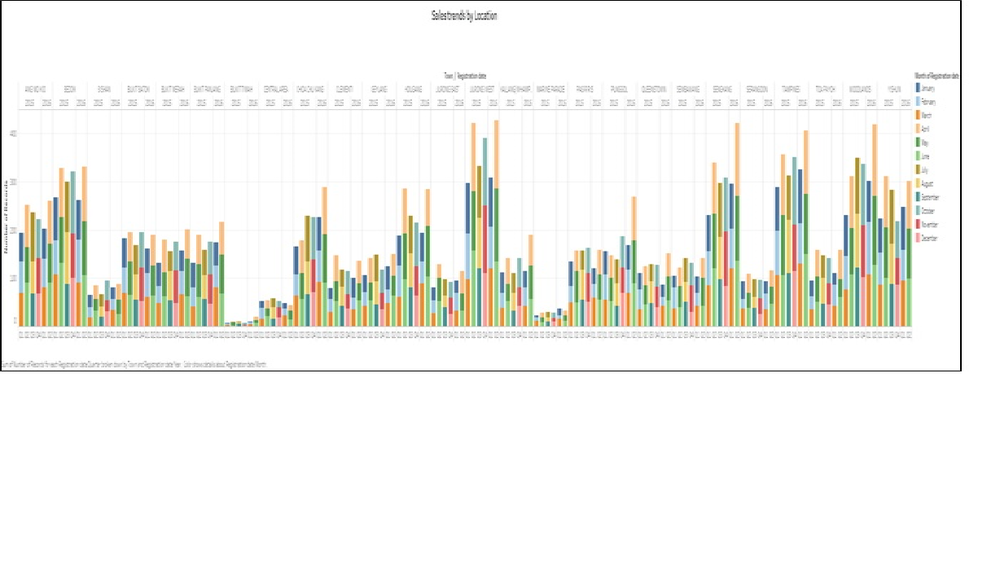
- Sales Trends by location: On analyzing the sales trends by locations, we notice that most of the locations follow a trend similar to the general trend.
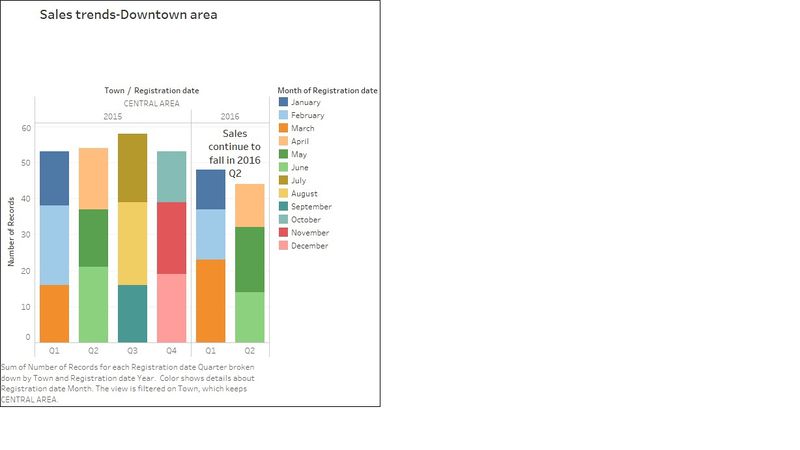
- On deep-diving into this graph, we notice that the downtown Area does not follow the general trend.
Results
From the above graphs, the following conclusions can be made:
- We notice the highest sales of flats happens in Q2 of 2015 and the same trend is seen in 2016. Ear end bonus recieved at the financial year could be the reason behind this trend.
- The market appears to be going down at the end of the year 2015 however the overall trend shows that the market picks up in the Q2 of 2016 after seeing a drop in Q1 of 2016.
DISTRIBUTION OF PRICES IN 2015
Approaches
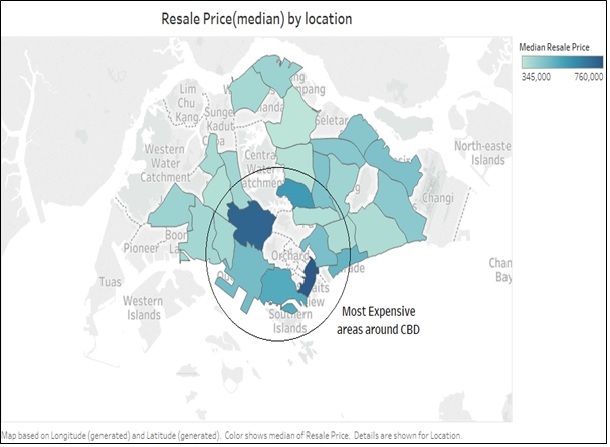
- Geographic distribution of prices: Below is the map of Singapore with color gradients indicating the median prices. It shows the prices based on geographical location.It can be observed that most expensive flats are located in the area around the downtown area
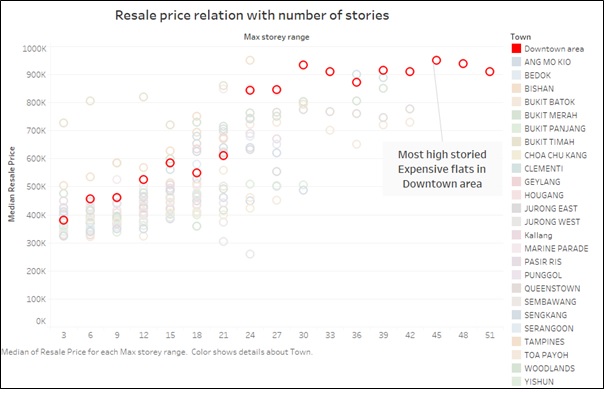
- Relation of Resale price with Number of Stories: As can be seen from the graphic, as the number of stories go higher, the prices appear to increase. On isolating the Downtown area, it can be noted almost all high storied expensive flats are located in Downtown Core.
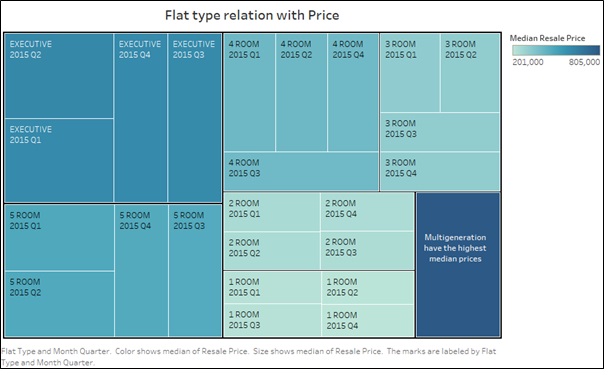
- Relation of price with flat type: As can be observed form the below figure, the highest price is garnered by Multi-generation housing. This is closely followed by Executive housing and then 5 room housing.
Results
From the above graphs, the following conclusions can be made:
- The most expensive flats are located around the Central Business District area. These high prices could be the reason for the sales dropping in Q2 2016 in the downtown core area as discussed in the previous section.
- Flats situated at higher stories garner higher prices. Most of these High storied expensive flats are located in Downtown area.
- The highest prices are garnered by Multi-generation housing. This is closely followed by Executive housing and then 5 room housing.
SHARE OF PUBLIC HOUSING IN 2015
Approaches
- Share of Sale of Flat by number of Rooms: A large population of Singapore seems to believe that a 4 bedroom HDB suits their needs the best.
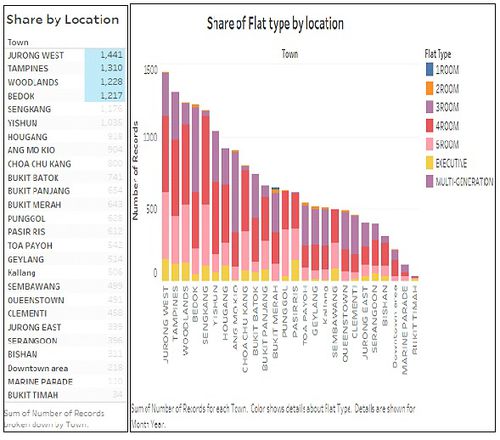
- Share of flat type by Location: The highest number of sales appear to be in the extreme east (Tampines) and extreme west (Jurong West) of Singapore. On cross referencing the below figure with the map in the previous section, we notice that the sale is higher in areas farther away from the downtown area.
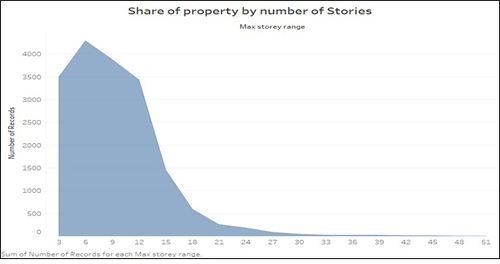
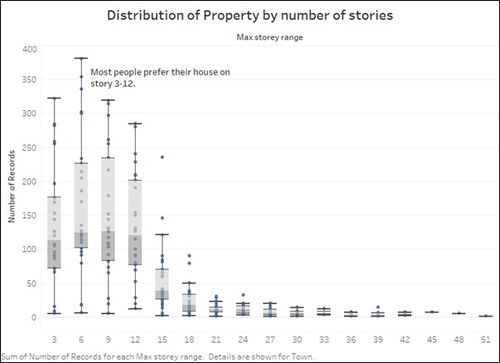
- Share of property by number of stories: Contrary to the popular belief, flats at higher floors are not very popular. Most people prefer to buy flats in stories between 3-12. This could be because of the direct relation between the number of story and the prices.
Results
From the above graphs, the following conclusions can be made:
- 4 Room flats are the most popular types of houses among Singaporeans.
- The highest sales take place in Jurong west and Tampines. This is closely followed by Woodlands. We can conclude that the sales are higher in areas where the prices are lower(referring to the map in section 2) ie away from downtown area.
- Most Singaporeans prefer to buy flats on stories between 3-12.
