ISSS608 2016-17 T1 Assign3 Thian Fong Mei Conclusion
Revision as of 20:14, 28 October 2016 by Fmthian.2015 (talk | contribs)
|
|
|
|
|
|
|
Tools
JMP Pro 12, Tableau 10 and Gephi 0.9.1 are used in this visualization.
The Tableau visualisation link is published at https://public.tableau.com/profile/christine.thian#!/vizhome/Assignment3_163/SenderCreightonPavillion
Conclusion
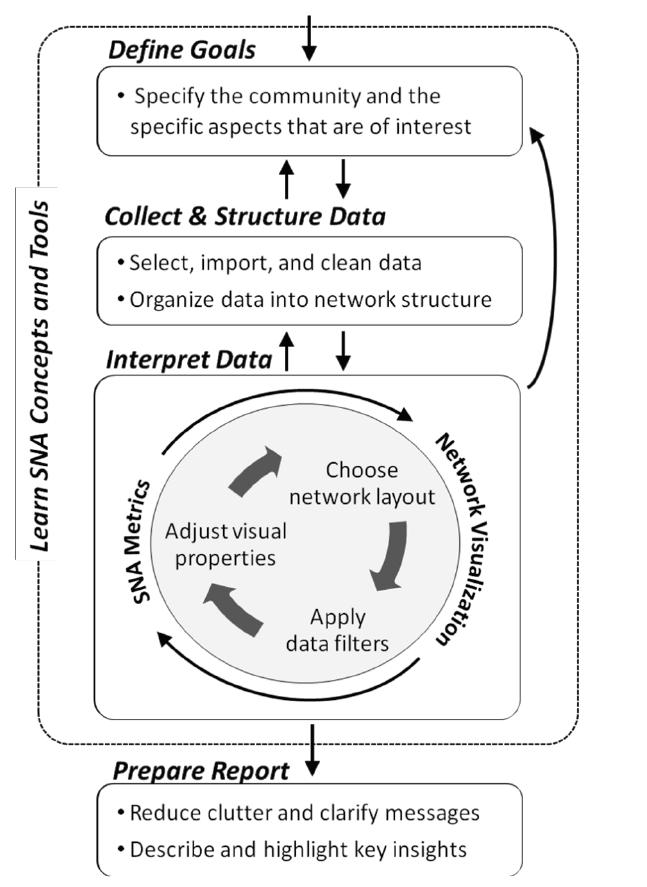
This visualization aims to follow the SNA framework. The challenges in getting the visualization came from integrating the records together in such a way location information is available. Even after integration, there is a challenge to trace individual comms/movement due to the amount of datapoints with many different visitors. The approach adopted in this visualization aims to zoom in to possible meaningful time range so as to draw insights and patterns.
