ISSS608 2016-17 T1 Assign3 WEI Jingxian
Contents
Introduction
DinoFun World is a tropical amusement park and it is hosting thousands of visitors each day. Except for Entry Corridor, there are four districts in the park, including Coaster Alley, Kiddie Land, Tundra Land and Wet Land. Facilities with different level of excitement are available in these four area.
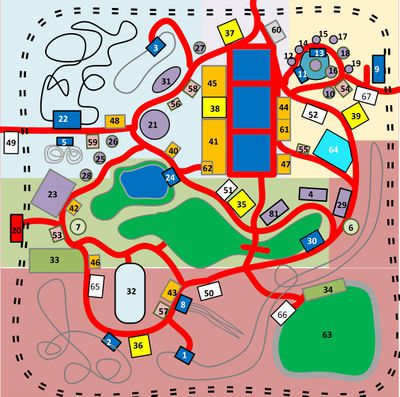
The famous soccer star would attend a set of events from 6 June to 8 June. Unfortunately, “Scott Jones Weekend” was marred by vandalism. There was a mayhem that disturbed the event in the park’s Creighton Pavilion (32 in the map). Although the crimes were rapidly solved, park officials and law enforcement figures would like to know what happened during the weekend, and would like to explore the communication and movement data to identify notable patterns, which may be related to the crime.
Data Information
The dataset given is the communication and movement data from the DinoFun World App. Ideally, all visitors to the park would use the park app to check in and communication with fellow visitors. Also, the communication data includes the records that visitors send to external.
| Date | Communication Data Counts |
|---|---|
| Friday, June 6 | 948,739 rows |
| Saturday, June 7 | 1,655,866 rows |
| Sunday, June 8 | 1,548,724 rows |
The sensors around the part will record the movements while visitors are using the app, except grid square or on the rides.
| Date | Movement Data Counts |
|---|---|
| Friday, June 6 | 6,010,914 rows |
| Saturday, June 7 | 9,078,623 row |
| Sunday, June 8 | 10,932,462 rows |
IDs with high-volume communications
Data Preparation
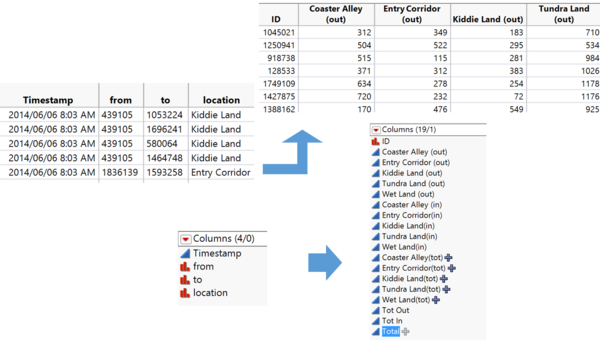
At first, we combine all the communication data in Friday, Saturday and Sunday. Since we want to find out those IDs with high-volume communications, we use JMP to convert the data into unique ID and calculated the communication counts for each ID. Also, we only select the top 100 IDs with high communications.
Findings
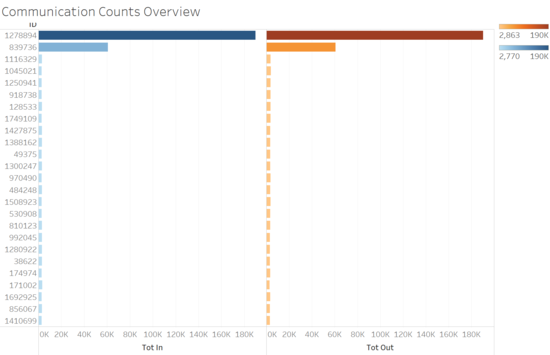
It is obvious that there are two IDs standing out. 1278894 has almost 400k total communications and 839736 has around 120k total counts, while other IDs have at most about 70k communications.
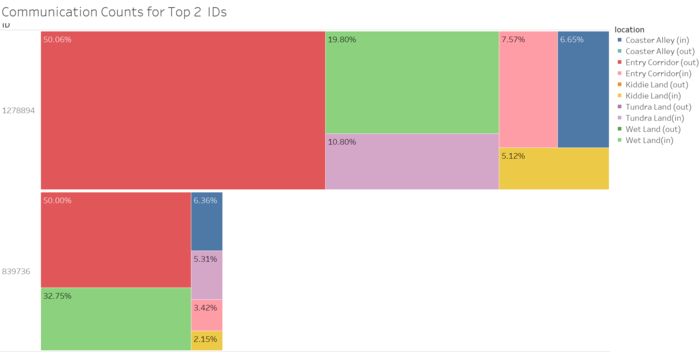
After we identified these two IDs, we would like to explore the communication patterns of them. The below figure shows that 1278894 and 839736 only call or send text at Entry Corridor (red area in the chart), but the messages sent to them are from everywhere around the park.
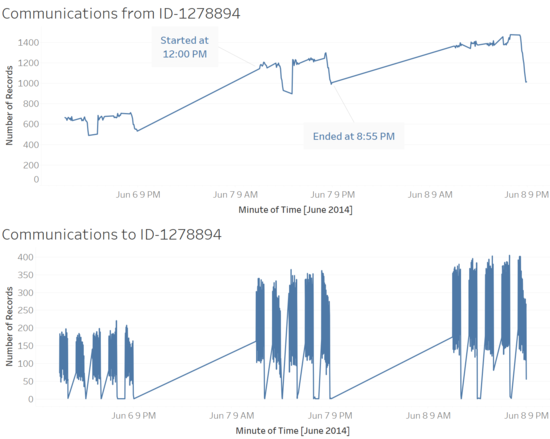
From the communication timeline of 1278894, we can easily find that every day it starts sending message /calling at 12pm and will stop sending at 8.55pm. The time of sending message is the same among three days. In addition, the time 1278894 paused was the time it received large communications.
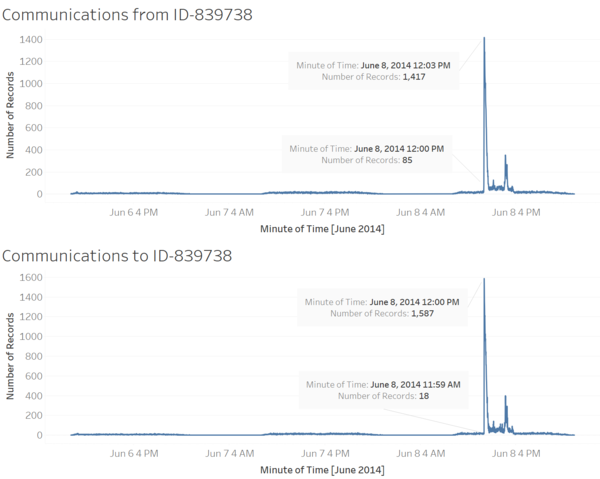
Unlike 1278894, the communication of 839738 had no regular patterns. The timelines of from and to 839738 communications are almost the same. There is a significant peak at around 12pm, Sunday.
Hypothesize
Based on the findings about 1278894 and 839738, we can hypothesize that these two IDs may be the information device of the park, but they have different functions.
- 1278894 sends and receives messages with a constant time interval, and the number of communication is the largest. It might be a device sending activity information, advertisements or some FAQ.
- 839738 sends and receives messages with no fixed schedule, also there is an unusual peak on Sunday. It may be the device sending real-time park status and notice about special events or accidents. Also, we can infer that the unusual peak at 12pm Sunday is a signal of emergency or accidents.
When was the vandalism?
In order to find out
