ISSS608 2016-17 T1 Assign3 WEI Jingxian
Contents
Introduction
DinoFun World is a tropical amusement park and it is hosting thousands of visitors each day. Except for Entry Corridor, there are four districts in the park, including Coaster Alley, Kiddie Land, Tundra Land and Wet Land. Facilities with different level of excitement are available in these four area.
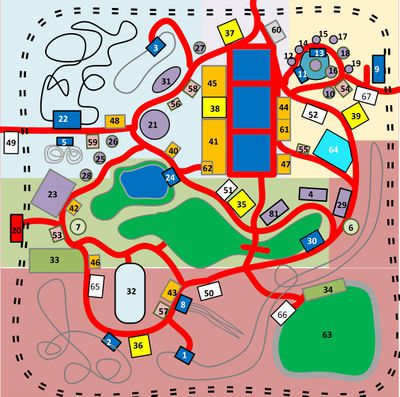
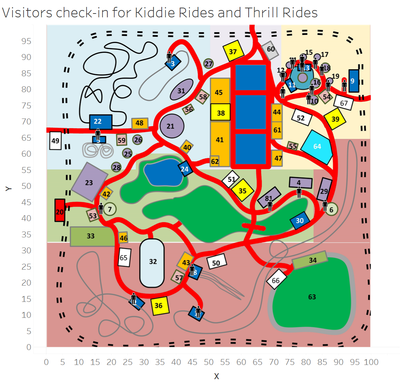
The famous soccer star would attend a set of events from 6 June to 8 June. Unfortunately, “Scott Jones Weekend” was marred by vandalism. There was a mayhem that disturbed the event in the park’s Creighton Pavilion (32 in the map). Although the crimes were rapidly solved, park officials and law enforcement figures would like to know what happened during the weekend, and would like to explore the communication and movement data to identify notable patterns, which may be related to the crime.
Data Information
The dataset given is the communication and movement data from the DinoFun World App. Ideally, all visitors to the park would use the park app to check in and communication with fellow visitors. Also, the communication data includes the records that visitors send to external.
| Date | Communication Data Counts |
|---|---|
| Friday, June 6 | 948,739 rows |
| Saturday, June 7 | 1,655,866 rows |
| Sunday, June 8 | 1,548,724 rows |
The sensors around the part will record the movements while visitors are using the app, except grid square or on the rides.
| Date | Movement Data Counts |
|---|---|
| Friday, June 6 | 6,010,914 rows |
| Saturday, June 7 | 9,078,623 row |
| Sunday, June 8 | 10,932,462 rows |
IDs with high-volume communications
Data Preparation
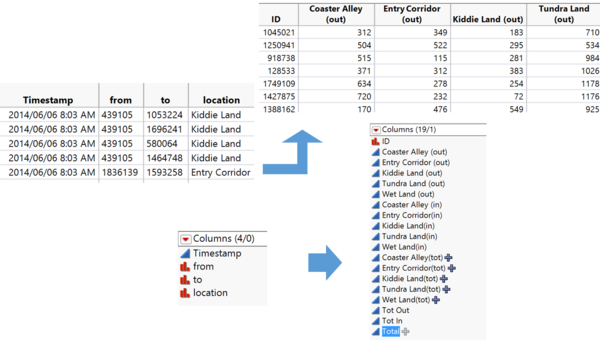
At first, we combine all the communication data in Friday, Saturday and Sunday. Since we want to find out those IDs with high-volume communications, we use JMP to convert the data into unique ID and calculated the communication counts for each ID. Also, we only select the top 100 IDs with high communications.
Findings
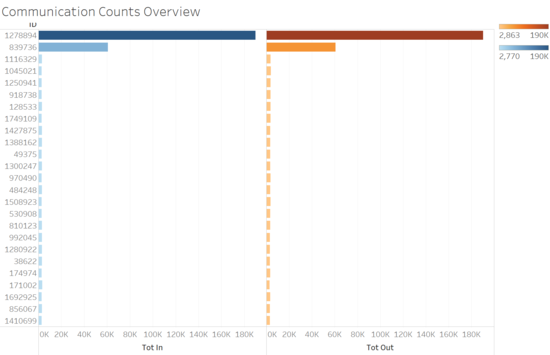
It is obvious that there are two IDs standing out. 1278894 has almost 400k total communications and 839736 has around 120k total counts, while other IDs have at most about 70k communications.
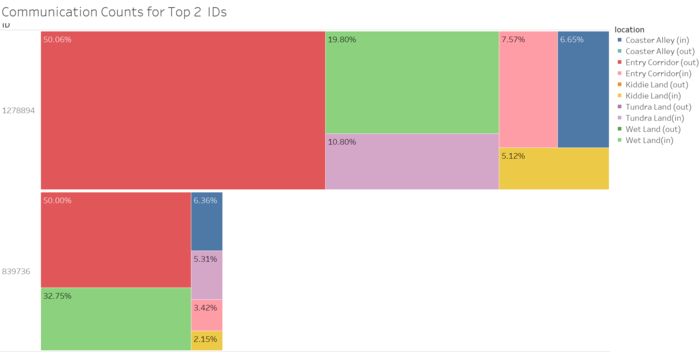
After we identified these two IDs, we would like to explore the communication patterns of them. The below figure shows that 1278894 and 839736 only call or send text at Entry Corridor (red area in the chart), but the messages sent to them are from everywhere around the park.
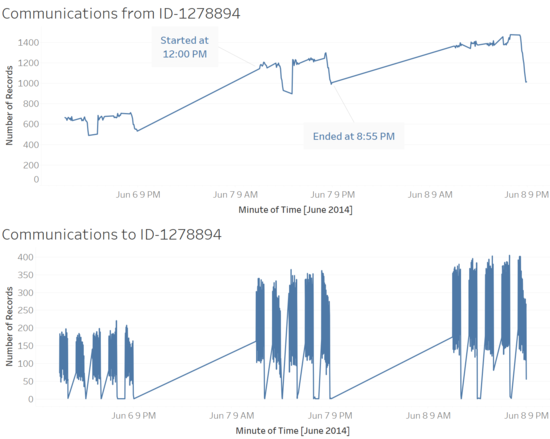
From the communication timeline of 1278894, we can easily find that every day it starts sending message /calling at 12pm and will stop sending at 8.55pm. The time of sending message is the same among three days. In addition, the time 1278894 paused was the time it received large communications.
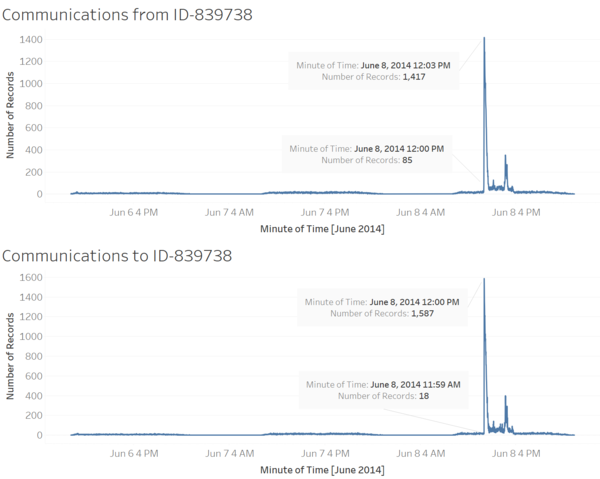
Unlike 1278894, the communication of 839738 had no regular patterns. The timelines of from and to 839738 communications are almost the same. There is a significant peak at around 12pm, Sunday.
Hypothesis
Based on the findings about 1278894 and 839738, we can hypothesize that these two IDs may be the information device of the park, but they have different functions.
ID 1278894 sends and receives messages with a constant time interval, and the number of communication is the largest. It might be a device sending activity information, advertisements or some FAQ.
ID 839738 sends and receives messages with no fixed schedule, also there is an unusual peak on Sunday. It may be the device sending real-time park status and notice about special events or accidents. Also, we can infer that the unusual peak at 12pm Sunday is a signal of emergency or accidents.
When was the vandalism discovered?
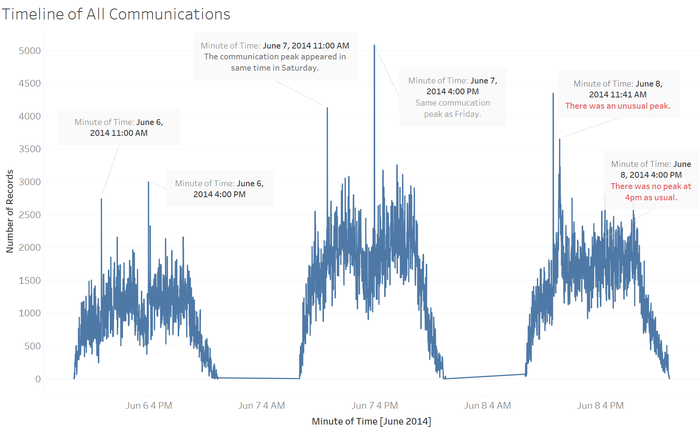
To find out when the vandalism was discovered, we check the timeline of all three days’ communication to see if there are any notable patterns. In the below graph, we can find that there are two peaks on Friday and Saturday, one was at 11am and another was at 4pm. Considering the event calendar provided by the park, we know that two Scott’s shows would be held daily. Therefore, we can hypothesize that the two shows are held at 11am and 4pm, and they were the time Scott showed up.
However, in Sunday, there was an unusual peak at 11:41am, and the regular peak at 4pm disappeared. Recalled the findings related to ID 839736, there was a significant peak at around 12pm. We can hypothesize that the time when vandalism was first discovered is 11:41pm and the park sent notice to visitors at 12pm, also the park cancel the shows at 4pm, Sunday.
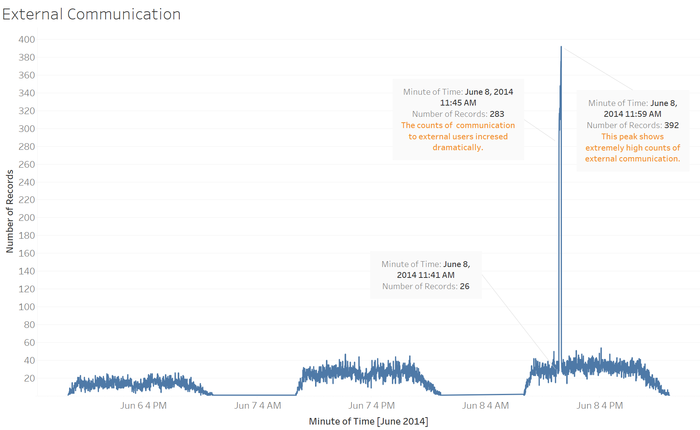
In addition, we suppose that visitors would like to communicate their families or friends outside the park when they discovered the vandalism, so here we check the external communication timeline. The graph below supports our hypothesis. From 11:41am, the external communication increased and reached to the top at 11:59am.
Therefore, we hypothesize that the vandalism was first discovered at around 11:40am, and the park noticed and took actions at around 12pm.
Who are the suspects?
Data Filtering
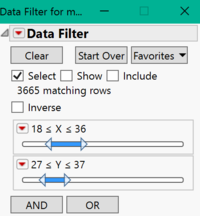
In order to find out suspects, we need to explore the notable patterns in the data and narrow down the list of suspicious IDs, because the number of visitors is quite large. Based on the hypothesis above, we try to filter out some IDs before we explore the patterns.
1. Sunday's movement data before 11:30am & IDs first check-in before 9:30am
As previous discussion, we infer that the vandalism was discovered at 11:41am Sunday. So we would like to set a cut-off at 11:30am, and explore the movement data before cut-off to identify suspicious IDs.
We know that the mayhem disturbed the events in the Pavilion, it means that the scene of the crime is Pavilion. However, when we checked all the movement data on Sunday, we found that from 9:30am to 11:30am there is no check-in to Creighton Pavilion. It seems that the Pavilion was temporarily closed at that period. Therefore, we only consider those IDs first checked in to the park before 9:30am on Sunday.
2. Exclude IDs check-in to Kiddie Rides and Thrill Rides
We assume that the criminal would not play the Kiddie Rides. Also, the Thrill Rides may have a long queue and it is time-consuming compared with other rides. Thus, we exclude IDs who checked in to Kiddie Rides and Thrill Rides.
3. IDs went to Creighton Pavilion (32 in the map)
We already know that the scene of crime is Creighton Pavilion, so we only include the IDs went to the area of Pavilion.
4. IDs went to the park at least two days
As general thinking, we assume that the criminal will prepare well for crime, so he need to be familiar with the park and choose the scene of crime. Therefore, we only include those IDs showed up at least two days during "Scott Jones Weekend".
After these three filtering, the unique IDs remained are 81. 47 of them have communication data while the rest 34 have no communication data.
IDs with Communication Data
For the 47 IDs who have communication data, we only explore the communication within these 47 IDs. After selected the communication within 47 IDs, there are 1280 communication records within 26 IDs.
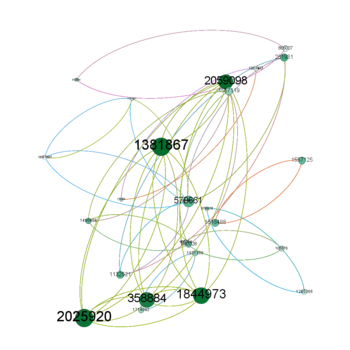
At first, we used all the 1280 records as input to Gephi and the network is shown below. The bigger the node, the more messages they sent. The darker the color, the more messages they received.
There are five IDs, who have both high receiving and sending messages. We suppose that criminals would not communication through the app, because they do not want to be tracked. If there are five criminals and they did use the app to communication, there must be a chief criminal, who may have higher volume of communication than other 4 IDs. In the network, it seems that these five IDs communicated with each other and there is no ID stand out. Therefore, we excluded these five IDs and restructure the network.
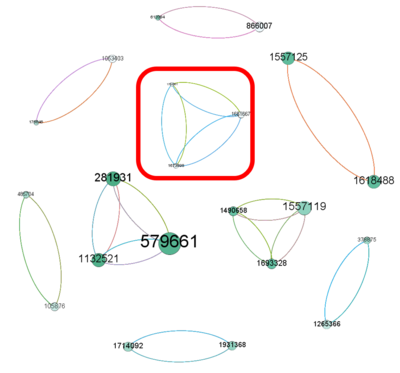
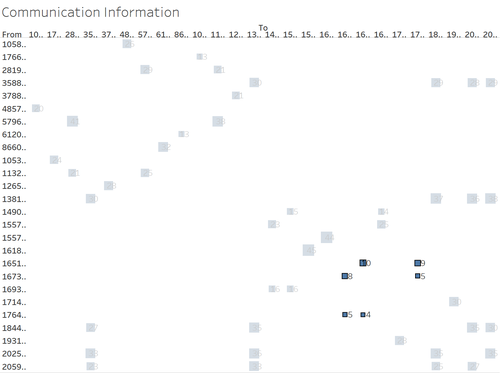
Based on the assumption we made above, we try to find out the group have lowest volume of communication. The group within the red rectangle has smallest size and lightest color. Thus, we explored more detail of this group. The IDs in these group are 1651667, 1673898 and 1764981.
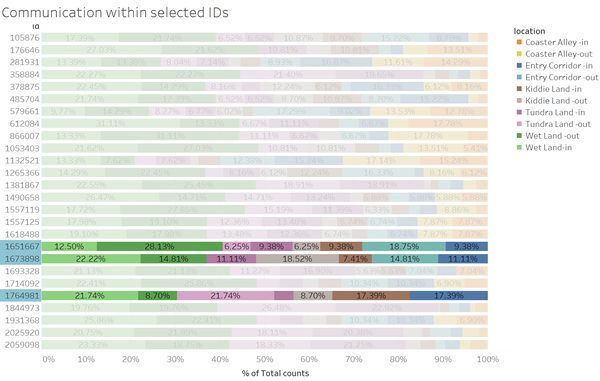
Based on the same dataset (26 unique IDs and 1280 records), we used tableau to check the communication within them. The following chart shows the same patterns as Gephi. The top 6 smallest volume of communication were from the group we identify above, which has ID 1651667, 1673898 and 1764981.
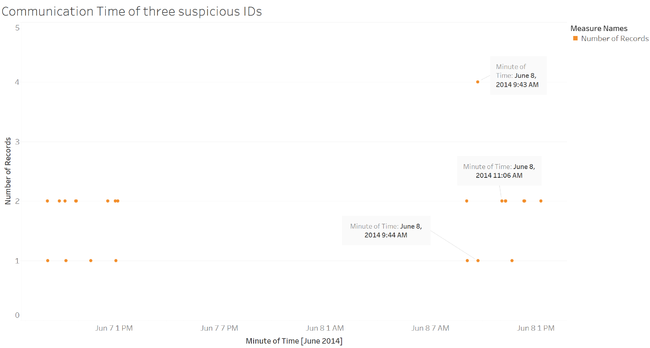
Since we consider the group as the most suspicious IDs, it is better to check their communication patterns. The following chart shows the timeline of the three IDs' communication. It shows that they did not came to the park on Saturday. And the time they communicated on Sunday is quite consistent with the time of the crime.
In addition, we checked the location when they communicated. Most of their communication happened at Wet Land, which is the nearest area to Pavilion, especial for 1651667 and 1673898
Therefore, as previous discussion, the most suspicious IDs are 1651667, 1673898 and 1764981, based on Sunday movement filtering and communication patterns.
IDs without Communication Data
We suppose that the criminal may not use the app, since they do not want to be track easily. So we try to find out the special movement patterns, to check if there are suspicious IDs. We found that there are several IDs, who stayed in the park for a short time and only check-in once or three times. It means that those IDs checked in for once did not play any facilities in the park, and it is quite wired that visitors go to amusement park and do not play any facilities.
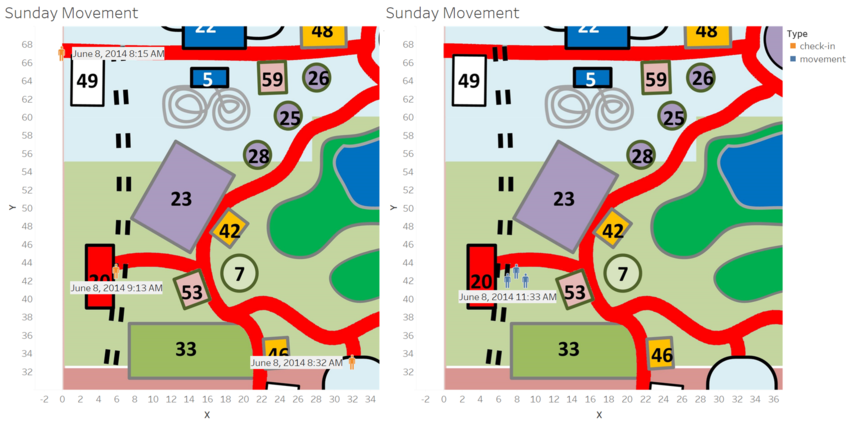
We tracked their movement on Sunday, Movements on Sunday. We found that 521750, 644885, 1600469, 1629516, 1781070, 1787551 and 1935406 have the same track on Sunday, so we hypothesize that these IDs may be the regular inspection of the park.
The remain ID, 1983765 has a significant wired track on Sunday. He did not go to any other area except for Wet Land and we know that Wet Land is where Pavilion locates at. After he checked in the park, he directly went to Pavilion and checked in at 8:32am. At 9:08am, he went out from Pavilion. Then he checked in to Scholtz Express(20) at 9:13am and stayed until 11:33am. After he spent more than 2 hours in Scholtz Express, he left the park directly at 11:47am.
The time he stayed in Express is consistent with the time of the crime. We can hypothesize that 1983765 knows the movement is tracking when he use the app. If he is the criminal, he would not like to let other know that he did go to Pavilion during the time of the crime may happened.
We infer that ID 1983765 checked in to Express on purpose, in order to show an illusive movement. After he checked in to the Express, he may leave his phone there or closed the app. Then he went back to Pavilion before it close at 9:30am and committed the crime. When Pavilion reopen at 11:30am, 1983765 can go back to Express and reopen his app.
Since he have enough time to commit the crime and his track is wired, we suppose that ID 1983765 is the most suspicious ID based on the movement information.
Conclusion
Based on Sunday movement filtering and communication patterns, the most suspicious IDs are 1651667, 1673898 and 1764981, while based on movement information, we suppose that ID 1983765 is the most suspicious ID.
