ISSS608 2016-17 T1 Assign2 Chris Thng Ren Jing
Contents
Abstract
Problem and Motivation
Visual Analytics Application Design Process
Step 1: Identify a theme of interest
Wikipedia is considered an “un-reliable” source of information by majority of internet users. However, how is this viewed in the academic aspect? Do they still use it despite this known phenomenon? Does this perspective differ in terms of domain? Age? Work experience? Explore and identify interesting points and correlations.
Step 2: Define questions for investigations
1. What are the demographics of the educators in UoC?
2. Do different faculties (domains) perceive Wikipedia differently?
Observe the contrast between the faculties and their view on Wikipedia’s QUALITY.
3. Does working experience affect their usage of Wikipedia?
Observe the contrast between the people with different working experience (0 – 10, 10 – 20, 20 or more) and their usage (EXP field).
4. Does age affect the ease of use of Wikipedia?
Observe the contrast between the people of different age groups (Young, Middle-Age, Senior) and views on the ease of use of Wikipedia.
5. Does gender affect the use behaviour of Wikipedia for developing educational materials/interacting with students?
6. Explore a potential correlation. Does having age have an impact with on their enjoyment of Wikipedia?
7. Do the years of experience one has affect their perspective on the quality of information from Wikipedia? Does Domain have any effect on this analysis?
Observe the contrast between the faculties and their view on Wikipedia’s QUALITY.
Step 3: Find appropriate data attributes
1. Cleaning the data
- Identified UOC Position: "?" Filter all non-UOC members. Delete these rows to find only UOC members (1-6) for data analysis.
- Identified Domain: "?" These UOC members do not have a domain they are teaching. Not useful towards data analysis, removed.
- Identified Years of Experience: "?" These members have not filled in how many years of experience they have. Not useful for data analysis, removed.
- Identified Other Position and Other Status Column. These are UOC members that belong to other universities too. Not useful for analysis since the focus is on UOC members, removed.
- Identified User Wiki: "?" 1 Row. They have not filled up the form properly (0 or 1), hence we will remove them as we are unable to ascertain this data properly.
- Identified Domain: "6". This domain is not defined in the UoC Data Dictionary, removed as it does not have meaning towards this analysis without any definition.
- Identified Missing Values within Question Columns: "?".
All questions with “?” were given a 1000 mark in order to idenitfy those who did not fill up some questions.
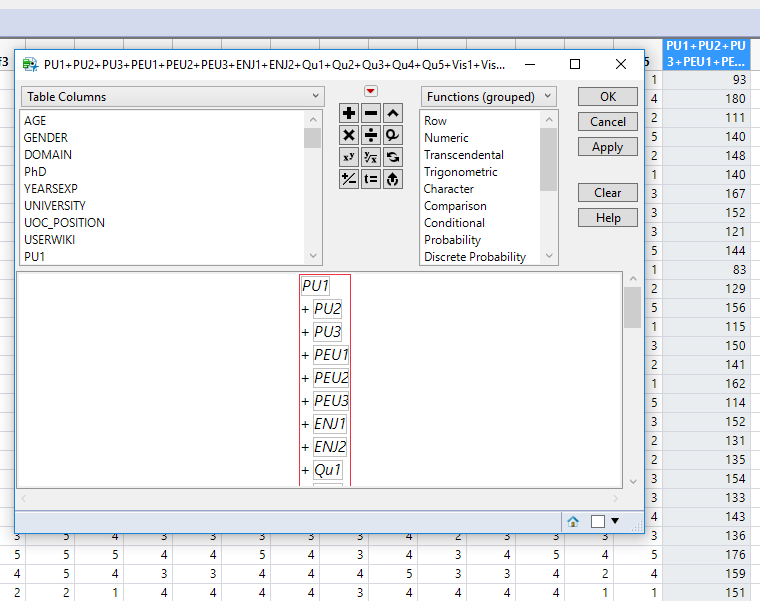
Did a sum of all question columns. Identified and filtered out rows in the thousand range. Non "?" rows will be within the hundred range.
Selected rows show that the surveyee has not filled up the survey properly, removed to ensure full data accuracy and integrity.

- Identified Surveyees who gave a "5" rating to every single question. Found 2 rows. Identified as odd, but left there as it is the surveyees opinion.
2. Data Transformation
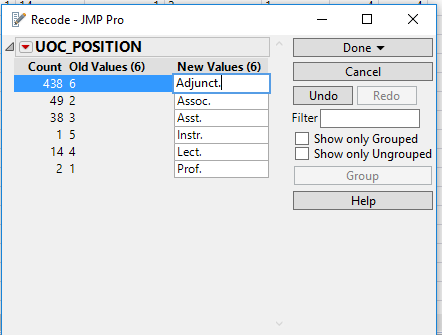
- Recoded UOC Position (1-6). Recoded based on the Data Dictionary, this will readers to understand the information easily.
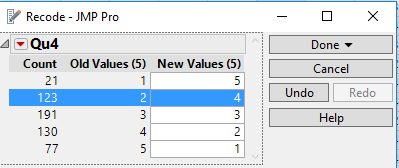
- Qu4: In my area of expertise, Wikipedia has a lower quaity than other educational resources?
This gives a negative rating towards the overall scoring. Hence, the question has been rephrased and the scoring has been adjusted proportionately.
New Q4: In my area of expertise, Wikipedia has a higher quality than other educational resources?
Scoring has been revised.
Previously scoring 1(strongly disagree) = New scoring 5(strongly agree)
Previously scoring 2(disagree) = New scoring 4(agree)
With this revision, the total scoring will show a score of how good Wikipedia is as an educational resource as opposed to being scored of how bad Wikipedia as an educational resource is.

- Rephrased the questions. This rationale behind this: after trying to input the data into a visualization, I realized that "PEU1" only provides the reader the question's unique ID and had to refer back to the Data Dictionary to find out what it meant, so I rephrased it to "PEU1: Is Wiki user-friendly?". This allows the reader to immediately identify what sort of question is being analyzed/visualized. This was done to all the questions.
- Creating a Binned column: Years of Experience from a continuous field to categorical field (0 to 10 YEARS, 10 to 20 YEARS, 20 YEARS +). Used the recode function after this step to convert the age range to characters.
- Creating a Binned column: Age from a continuous field to categorical field (25 to 35, 35 to 45, 45 onwards) -> (Young, Middle-Age, Senior). Used the recode function after this step to convert the age range to characters.
Verdict
Results
Tools Utilized
- Tableau
- Excel Data
- Paint
- Wikipedia
Limitations
Tableau
Although it has gone through many upgrades and has a great user interface, many basic functions such as highlighting, labeling, scale-sizing and etc. are too complex, it requires the user to go through a filter parameter/calculated field/rule-based function in order to conduct such a basic function. I would prefer if it were to be similar to excel, which allows the user to either use conditional formatting or manual formatting, this creates flexibility. Other than that, it is a great software to analyze data!
Data
The data derived from Data.gov.sg is limited and more often that not varies in terms of format (year to year basis). This hinders analysis and requires the user to search for other sources to piece together a clear picture of the data set.
The data used, 2015-2016, is very limited in terms of identifying trends and may not that be that reliable considering it is only a span of 1 year as compared to data spanning a range of 10 years.
General observations
