ISSS608 2016-17 T1 Assign2 Chen Yi Fan
Contents
- 1 Overview
- 2 Dataset Preparation
- 3 Data Exploration
- 3.1 What are the participants’ demographics?
- 3.2 Is there any difference of perception for Wikipedia by participants’ demographic distribution?
- 3.3 How do the faculty members perceive Wikipedia in terms of its quality and usefulness?
- 3.4 How and which areas do faculty members use Wikipedia for?
- 3.5 How does users’ perception affect the user behaviour?
- 4 Visualisation Software
- 5 Comments
Overview
Wikipedia is a free-content online encyclopaedia founded in 2001, collaboratively developed over the Internet in more than 250 different languages. It is the largest and most popular general reference work on the Internet and is ranked among the ten most popular websites1.
It has been used in many areas such as academic studies, books, conferences, court cases etc.
In our study for this assignment, a survey dataset2 is provided of faculty members from two Spanish universities on teaching uses of Wikipedia. We are tasked to find out any interesting information conveyed by this survey.
Dataset Preparation
The csv data file contains 913 rows and 54 columns. The values for the categorical attributes are entered in numeric forms. With the data dictionary from the dataset webpage, I used JMP to recode the numeric values into their string format. The missing values denoted as "?" have also been removed from the list.
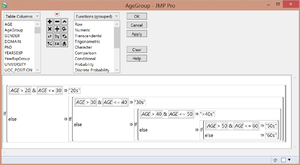
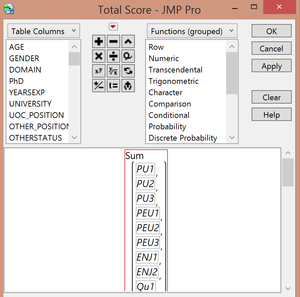
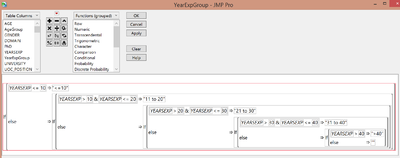
3 new columns have also been created, namely AgeGroup, YearExpGroup and Total Score to facilitate the analysis later on.
The final dataset after the above transformation is shown below. It is exported as csv format from JMP.
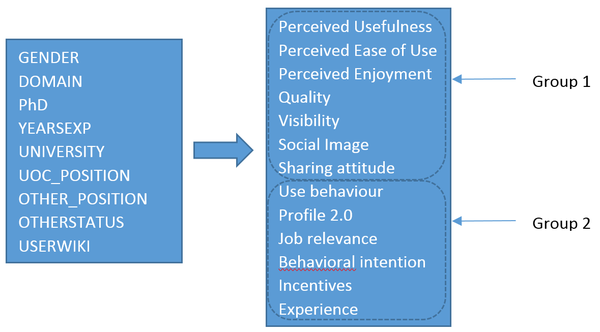
Out of the total 53 columns, 9 of them are the demographic information of the faculty members who participated in this survey, e.g. gender, domain, year of experiences etc. The other 44 columns are their responses to the survey questions. They are grouped into 13 categories. Furthermore, we can split the 13 categories into 2 groups. The first group includes 7 metrics: Perceived Usefulness, Perceived Ease of Use, Perceived Enjoyment, Quality, Visibility, Social Image and Sharing attitude. They mainly measured the usefulness and effectiveness of Wikipedia from different perspectives. From another group of factors, we can get a sense of how the faculty member made use of the Wikipedia, in which areas do they use Wikipedia for, how would they contribute to Wikipedia etc.
After the above data preparation, there are a few questions being raised.
- What are the participants’ demographics?
- Is there any difference in terms of perception for Wikipedia by participants’ demographic distribution?
- This could be answered using group 1 data and the calculated field “Total Score”
- How do the faculty members perceive Wikipedia in terms of its quality and usefulness?
- This could also be addressed using group 1 data
- How and which areas do faculty members use Wikipedia for?
- This could be answered using group 2 data
- How do users’ perception affect their behaviour?
- This could be answered by analysing the relationship between different measurement metrics
Data Exploration
Next, the pre-processed csv dataset is imported into different visualization tools to help answer those questions.
What are the participants’ demographics?
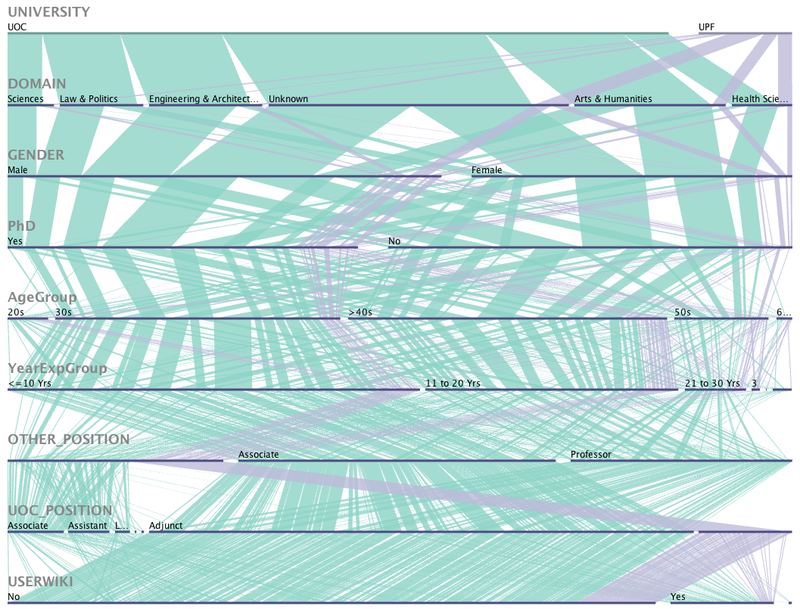
Firstly, in order to understand participants’ demographics, the data is imported into Parallel Set as shown in the chart below.
It shows that majority (87%) participants are from UOC but only 13% are from UPF. There are more male (57%) than female (42%) participants and mainly at the age ranging from 30s (37%) to 40s (42%) with the year of experiences less than 20 years (54% < 10 years and 33% 10 to 20 years).
However, it is also noticed that most of the participants (85%) are not Wikipedia registered user.
Is there any difference of perception for Wikipedia by participants’ demographic distribution?
As it is shown above, the participants’ demographic distributions are not even, this could affect the overall perception for the usefulness and effectiveness of Wikipedia.
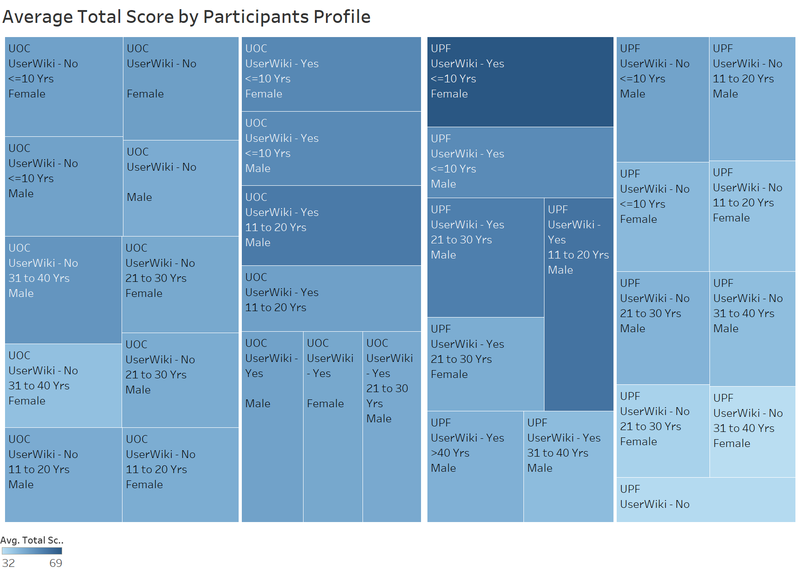
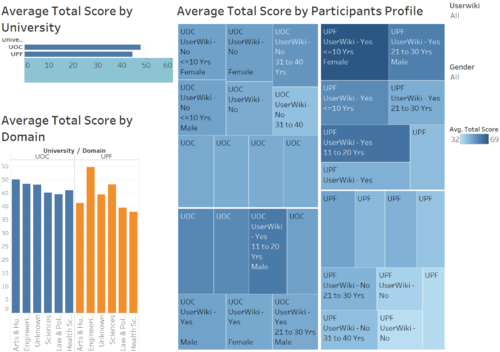
Hence, next I plot the graph using the dimensions, e.g. University, Userwiki, Gender and YearExpGroup in tree map to understand further how these factors affect the total score.
It shows from the graph below, females with less than 10 years working experiences Wikipedia registered users gave the highest average total score. In fact, the top 5 groups who score highest are all Wikipedia registered users. And the top 3 groups are the users with less than 20 years working experiences.
How do the faculty members perceive Wikipedia in terms of its quality and usefulness?
The group 1 likert scales are listed in the table below. Each of the scales are represented by a short label to be easier plotted in the chart. This group of metrics mainly measure the faculty members’ perception for the usefulness and quality of Wikipedia contents.
| Likert Scale | Survey Items | Label |
|---|---|---|
| Perceived Usefulness | PU1: The use of Wikipedia makes it easier for students to develop new skills | Develop New Skills |
| PU2: The use of Wikipedia improves students' learning | Improve Learning | |
| PU3: Wikipedia is useful for teaching | Useful for Teaching | |
| Perceived Ease of Use | PEU1: Wikipedia is user-friendly | User Friendly |
| PEU2: It is easy to find in Wikipedia the information you seek | Easy to Search | |
| PEU3: It is easy to add or edit information in Wikipedia | Easy to Add/Edit | |
| Perceived Enjoyment | ENJ1: The use of Wikipedia stimulates curiosity | Stimulate Curiosity |
| ENJ2: The use of Wikipedia is entertaining | Entertaining | |
| Quality | QU1: Articles in Wikipedia are reliable | Reliable |
| QU2: Articles in Wikipedia are updated | Up-to-date | |
| QU3: Articles in Wikipedia are comprehensive | Comprehensive | |
| QU4: In my area of expertise, Wikipedia has a lower quality than other educational resources | Lower Quality | |
| QU5: I trust in the editing system of Wikipedia | Trust in Editing System | |
| Visibility | VIS1: Wikipedia improves visibility of students' work | Improve Visibility |
| VIS2: It is easy to have a record of the contributions made in Wikipedia | Record of Contributions | |
| VIS3: I cite Wikipedia in my academic papers | Cite in Academic Papers | |
| Social Image | IM1: The use of Wikipedia is well considered among colleagues | Considered Among Colleagues |
| IM2: In academia, sharing open educational resources is appreciated | Appreciated of Sharing | |
| IM3: My colleagues use Wikipedia | Used by Colleagues | |
| Sharing attitude | SA1: It is important to share academic content in open platforms | Share in Open Platforms |
| SA2: It is important to publish research results in other media than academic journals or books | Share in Other Media | |
| SA3: It is important that students become familiar with online collaborative environments | Familiar with Online Collaborative Platform |
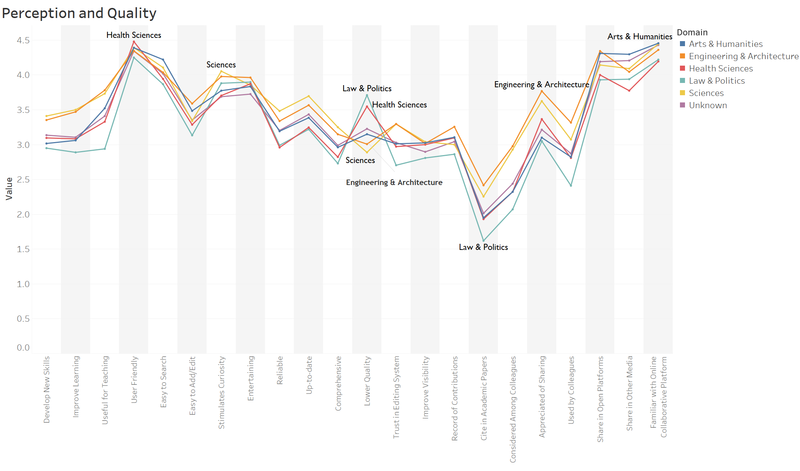
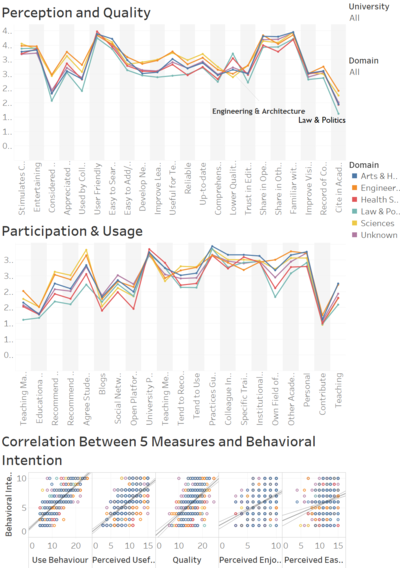
The parallel coordinate chart below shows that users generally deem Wikipedia user friendly and helpful in stimulating curiosity as well as entertaining in editing it. But it is considered not easy to add and edit information in Wikipedia. It also shows that the faculty members don’t cite Wikipedia frequently in their academic papers, especially in Law & Politics domain although they do express the importance of sharing academic contents in open platforms. This might be explained by QU4 index which indicates the quality of Wikipedia content in the area of expertise. Specifically, Wikipedia for Law & Politics and Health Sciences related contents are perceived to be lower quality than other educational resources as compared to other domains, such as Sciences and Engineering & Architecture.
How and which areas do faculty members use Wikipedia for?
Group 2 likert scales measure in which area the 2 university faculty members use Wikipedia and whether they contribute to the online platforms including Wikipedia.
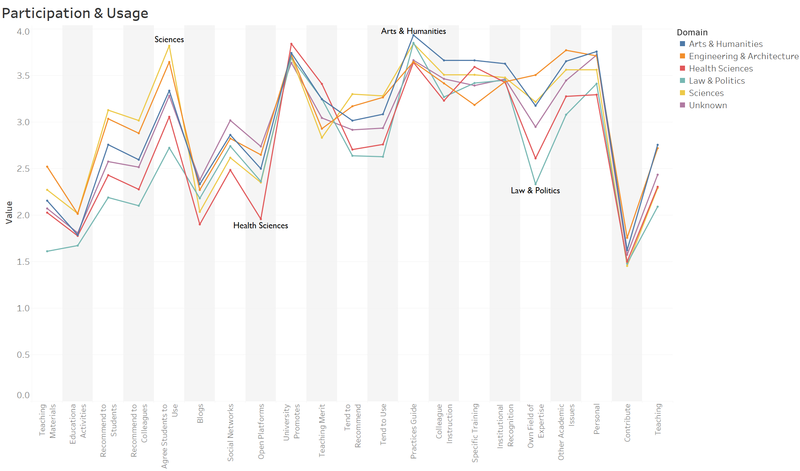
The 2nd parallel coordinate chart below illustrates the total score for each of these metrics.
| Likert Scale | Survey Items | Label |
|---|---|---|
| Use behaviour | USE1: I use Wikipedia to develop my teaching materials | Teaching Materials |
| USE2: I use Wikipedia as a platform to develop educational activities with students | Educational Activities | |
| USE3: I recommend my students to use Wikipedia | Recommend to Students | |
| USE4: I recommend my colleagues to use Wikipedia | Recommend to Colleagues | |
| USE5: I agree my students use Wikipedia in my courses | Agree Students to Use | |
| Profile 2.0 | PF1: I contribute to blogs | Blogs |
| PF2: I actively participate in social networks | Social Networks | |
| PF3: I publish academic content in open platforms | Open Platforms | |
| Job relevance | JR1: My university promotes the use of open collaborative environments in the Internet | University Promotes |
| JR2: My university considers the use of open collaborative environments in the Internet as a teaching merit | Teaching Merit | |
| Behavioral intention | BI1: In the future I will recommend the use of Wikipedia to my colleagues and students | Tend to Recommend |
| BI2: In the future I will use Wikipedia in my teaching activity | Tend to Use | |
| Incentives | INC1: To design educational activities using Wikipedia, it would be helpful: a best practices guide | Practices Guide |
| INC2: To design educational activities using Wikipedia, it would be helpful: getting instruction from a colleague | Colleague Instruction | |
| INC3: To design educational activities using Wikipedia, it would be helpful: getting specific training | Specific Training | |
| INC4: To design educational activities using Wikipedia, it would be helpful: greater institutional recognition | Institutional Recognition | |
| Experience | EXP1: I consult Wikipedia for issues related to my field of expertise | Own Field of Expertise |
| EXP2: I consult Wikipedia for other academic related issues | Other Academic Issues | |
| EXP3: I consult Wikipedia for personal issues | Personal | |
| EXP4: I contribute to Wikipedia (editions, revisions, articles improvement...) | Contribute | |
| EXP5: I use wikis to work with my students | Teaching |
It is interesting to note that although the universities do promote to use open collaborative environments in the Internet, it is however not recognized as teaching merit.
Teachers agree students to use Wikipedia in their courses. But it does not show they are willing to recommend as well as practice in their teaching activities. Wikipedia is used more often for other academic related issues and personal issues than their own field of expertise. As a result, it shows very low interest among the faculty members to contribute to Wikipedia.
How does users’ perception affect the user behaviour?
To answer this question, 5 measurement scales are selected, i.e. Use Behaviour, Perceived Usefulness, Quality, Perceived Enjoyment and Perceived Ease of Use to analyse their relationship between Behavioral Intention. The reason to select these measurements is because they directly reflect users’ perception on how usefulness of Wikipedia. As a result they will affect their intention to use or recommend Wikipedia to other colleagues and students in the future.
From the chart above, it is observed that Use Behaviour has a higher correlation with Behavioral Intention at R-Squared = 0.65 whereas Perceived Ease of Use has the least correlation with Behavioral Intention at R-Squared=0.06.
Visualisation Software
To compare with Tableau, I've explored Qlik Sense and Power BI. It is found out that Qlik Sense is not intuitive for new user and less powerful in processing data as compared with Tableau. Power BI has both online and desktop version. As a product of Microsoft, it is well integrated with Excel. It also allows users to publish their visual analysis online. However as compared with Tableau, it also lack of the flexibility to manipulate the data.
| Dashboard 1 3 | Dashboard 2 4 |
|---|---|
| The first dashboard as shown below is to give the overall picture of the survey outcome by university, domain and participants profiles. | In the 2nd dashboard, details of the measurement metrics are examed to understand the underlying perception of the survey participants. |

