ISSS608 2016-17 T1 Assign1 Nguyen Tien Duong
Contents
Abstract
Singapore housing is always one of the top-most concern of residence in the country. This project aims to study, discover, and evaluate the local public housing market structure, trends and any further information that can provide as a trustful, insight to guide new business, investment and household to buy public property in Singapore.
In this project we are concentrating to data in year 2015 and bench-marked for trend moving in 2016.
Problem and Motivation
Aims of this study is:
- Graphically and interactively discover and present Singapore Public housing information.
- Make a firm justification and evaluation to guide market (on trends and possibility).
- Couple with real context information related to Singapore policy and economy to elaborate the sight extracted from data.
Approaches
Tools Utilised
This is a solely Tableau-based product.
Tableau - Data preparation, manipulation and presentation
Results
Overall Housing Data
1. Housing Ages in Singapore have 3 peaks:
2. Singapore is small island, but high demand for multiple room-type housing (4, 3 and 5 rooms)
3. Public Housing remains its shares among type of house and having recovering signal
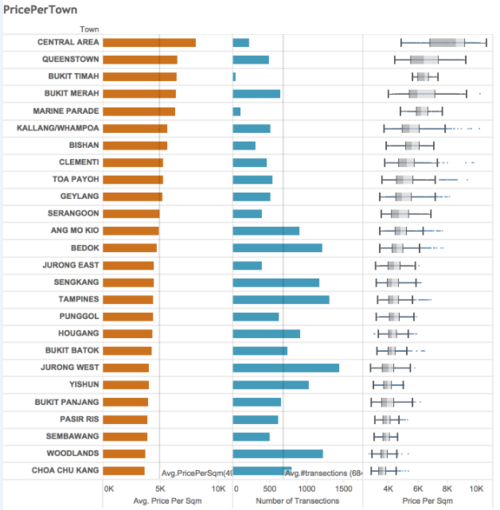
Geometrical Distribution Housing and its price
An obvious contrast has been drawn out for 2 regions of Singapore housing: Services (central) and Industrial (industrial lands)
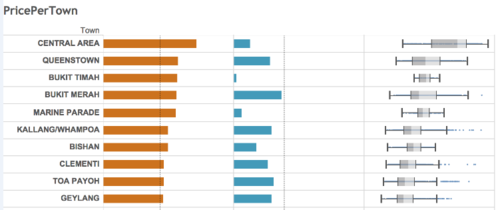
1. Central areas: leading price, high deviation (wide range) in pricing, but less small market
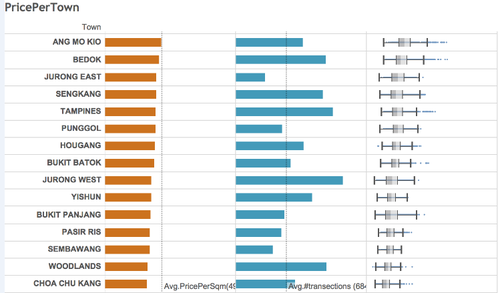
2. Industrial areas:below average price, less variation, and leading market share in terms of units
Majority house floor size and price
The chart presented density of transactions happening in Singapore in 2015 with regarding to Floor Area and Price per square meter (psm). Highlighted color area (in orange) is majority group.
1. Majority 85% houses have floor area below 150 sqm
2. Majority 85% houses resale price below SGD5500 sqm
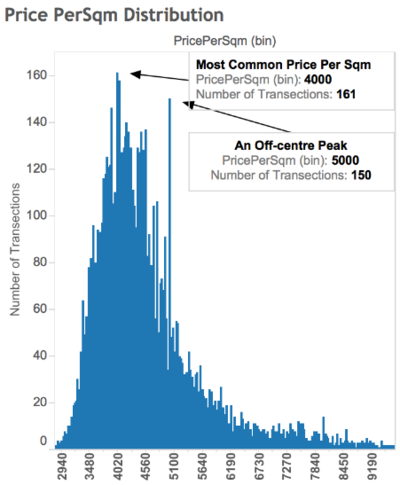
Major price psm is in range SGD 3800-4500, and SGD5000
1. Major prices are in range SGD 3800-4500 psm
2. $5000 psm is "favorite" price with a abrupt sharp peak
Market Movement
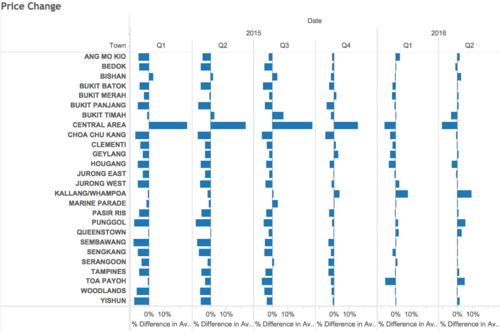
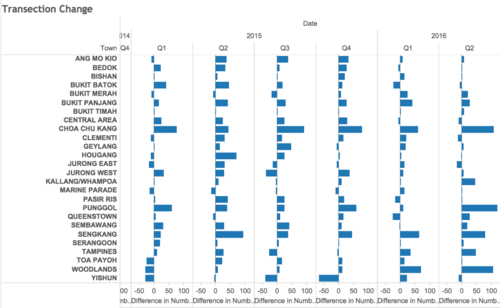
Observing the change in 2015 to 2016 by quarter in terms of price and buy transactions we found the new trends of market is to move out from costly city central and find house in re-development lands.
1. Central Areas lost growth rate
Continuously, central are loosing growth rate in terms of price and also number of transactions. It changes from high positive growth to negative in the last 2 quarters of 2016. No signal of recovering.
2. Re-development lands gain interest
Sengkang, Pungol and Woodlands are attracting by its own below-market price and new plan of movement to redevelop the infrastructure in those land, which bring a kick to price and interest of market, showing a positive-trend moving of price recovering and more buyers are hunting for house here.

