ISSS608 2016-17 T1 Assign1 WEI Jingxian
Contents
Abstract
Problem and Motivation
Public housing is an icon of Singapore, and HDB flats are home to over 80% of Singapore's resident population (ref). However, sometime it is not easy for resident to apply flats due to financial or other problems. The resale flat is a good choice for these resident. We purpose to provide a clear view of resale flats for residents who are interested in resale flats and help them in making decisions. The dataset we used is from HDB. resale-flat-price
There are two key variables related to resale flats market, including supply and price. For people who want to buy a flat, the essential factor they concern about is price. Also, apart from price, people would also care about locations of flats. Therefore, we would like to show insights for following three aspects.
- How many resale flats are selling in 2015?
- 1. The supply for different flat types
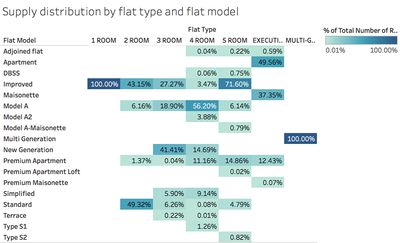
- 2. The supply for different flat model
- 3. The supply in different location
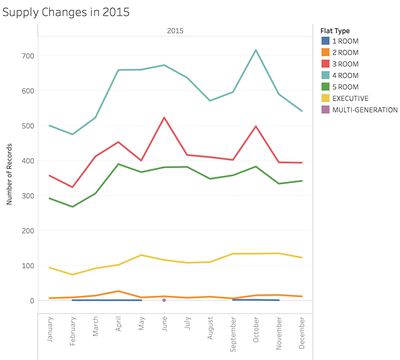
- 4. The trend of supply in 2015
- What is resale flats price in 2015?
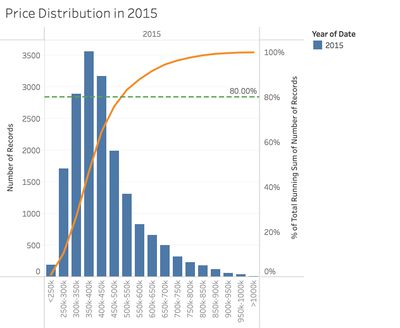
- 1. Price distribution
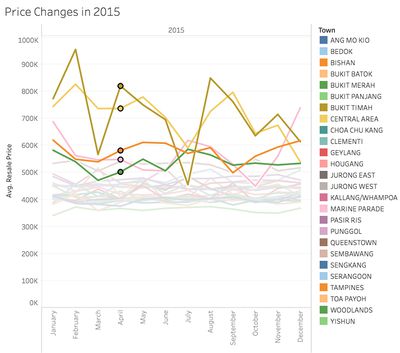
- 2. Price fluctuation
- 3. Price in different locations
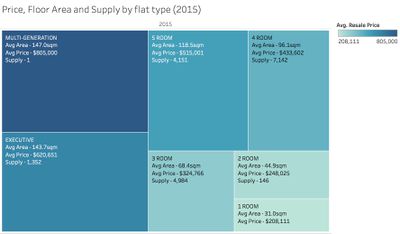
- 4. Price and floor area for different flat type
- Comparison between the first-half of 2016 and 2015.
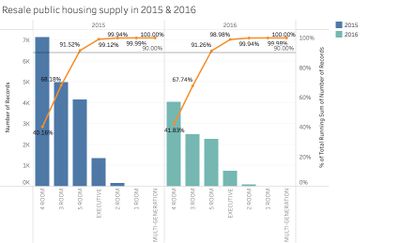
- 1. Supply of resale flats
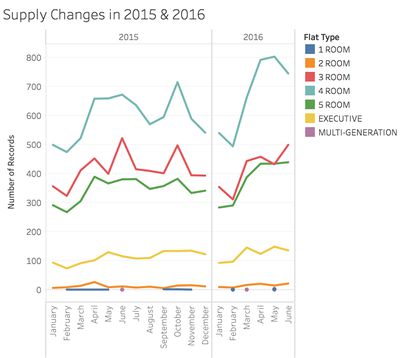
- 2. Supply changes by flat types
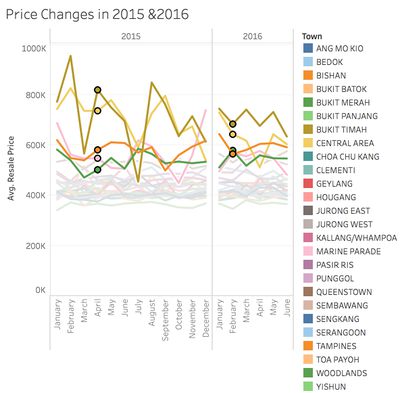
- 3. Price changes by locations
Approaches
Data Preparation
There are ten variables in the dataset, including registration date, flat information, and flat price. The sample data has shown below. Noticed that the date variable Month is treated as string in Tableau, so we need to calculate a new variable, which is in date format in Tableau, so that we can use the variable to do further analysis.
Supply Distribution of resale flat


