ISSS608 2016-17 T1 Assign1 CHIA Yong Jian
Abstract
<TBD>
Problem and Motivation
The public housing resale market is a closely watched market. A quick search on news revealed that the public housing resale market movement is watched closely almost on a monthly basis, especially for indicators hinting the stability or trend of the prices. These are crucial information not just for real estate companies, but also buyers and sellers of resale flats. This analysis is focused on providing relevant information that can aid buyers and sellers of resale flats to make informed decisions when deciding to buy or sell a flat.
- For buyers, they include newly-wed couples that may urgently need a house for their family needs. Knowing the prices of resale flats by areas can allow them to decide on a suitable area for house-hunting depending on their budget and preferences for amenities in the area
- For sellers, they are existing house owners that might be watching the market to understand the general market trends to decide on a good price to sell their houses.
We assume that the buyers are sellers are the general population where they might be untrained in statistics. Hence, charts would be generally designed from an approach that are visually attractive without unnecessary fluff, and requires little time for them to understand without requiring statistical knowledge.
Data
Data Acquisition
From Data.gov.sg
The dataset used to answer the above questions can be found from Data.Gov.Sg: Resale Flat Prices . There are two datasets available on the webpage. We will be using the resale flat prices data that includes data for the year 2015 to first half 2016, to answer the questions required.
From HDB Website
Supplementary data from HDB website is used to understand better the resale flat supply by the 23 towns and 3 estates planned by HDB, by normalizing the resale flats sold by the total flat supply in the area. The data is retrieved from HDB Towns: Your Home .
Dataset Variables
In the data.gov.sg dataset, a quick review of the variables reveals no missing data.
The dataset includes the following variables:
| Variable Name | Description | Example Levels/Values |
|---|---|---|
| Month | The 4-digit year and 2-digit month of the transaction | From “2012-03” to “2016-06” |
| Town | Includes the 23 towns and 3 estates under HDB planning | ANG MO KIO BEDOK BISHAN |
| Flat Type | The flat type sold. More information can be gotten from HDB: Types of Flats | 1 ROOM 5 ROOM EXECUTIVE |
| Block | The block number of where the flat was sold. | 99C 99B 977 |
| Street Name | The street name in the town or estate where the flat was sold. | ZION RD YUNG SHENG RD WHAMPOA WEST |
| Storey Range | The storey of the flat sold. Ranges from first floor to highest fifty-first floor. Floors are binned to groups of 3 to 5, and may include overlaps | 01 TO 03 25 TO 27 43 TO 45 |
| Floor Area Sqm | The floor area of the flat sold. Ranges from 31 to 280 square metres. | 45 74 92 |
| Flat Model | The model type of the flat sold. There are 19 types. Details of the different flat models can be view on a website providing comprehensive information: HDB History and Floor Plan Evolution | Adjoined Flat Model A New Generation |
| Lease Commencement | The starting year of the flat lease, typically a 99-year period | 1966 2004 2013 |
| Resale Price | The transacted price of the flat sold. | $195,000 $515,000 $1,088,888 |
Data Modelling
The following are changes made before charting was done on Tableau: <TBD>
| Variable | Changes Made | Rationale |
|---|---|---|
| Example | Example | Example |
| Example | Example | Example |
Approaches
General Colour Scheme for Charts
A consistent colour scheme was used in the charts to retain a sense of familiarity with the readers and reduce confusion.
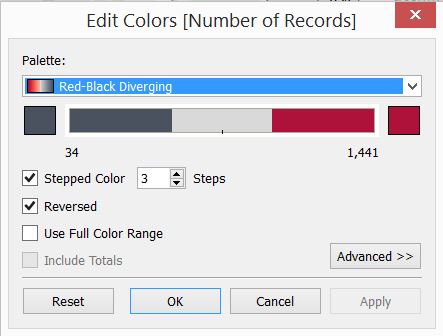
Several colour schemes was experimented for use across the charts. The final colour scheme selected deliberately used contrasting colours. Depending on the chart used, either 3 steps or 5 steps colours was used to allow readers to easily understand the concept of "high, medium, low" without further explanation.

Data Analysis
An overlay of the number of resale transactions by each HDB town or estate on the Singapore Map reveals that towns with the most resale flat transactions are from Jurong West, Tampines, Bedok, Sengkang and Woodlands. It can be observed that most of these areas are well built-up, and includes amenities such as shopping centres.
Visualisation rationale: <TBD>
Tools Utilised
- SAS JMP 12 – for initial data exploration and analysis
- Tableau 10.0 – for charting
- Microsoft Powerpoint – for Infographics layout

