ISSS608 2016-17 T1 Assign1 Mukund Krishna Ravi
Contents
ISSS608_2016-17_T1_Assign1_Mukund Krishna Ravi
Abstract
Problem and Motivation
The main Problem which is faced by Singaporeans the kind of flats they should invest their money in. They could either invest in second hand property or in first hand property. This decision is carried out by analyzing various parameters.But , considering the ever increasing population(foreign and local) the number of first hand flats is on a decline. Hence the logical option in this situation would be to invest in a Second hand flat. To make an investment a person would have to analyze multiple factors such as resale value, price per square feet, the storey range etc . To understand all of this visualizations have been used. The data from the year 2015 and the early part of 2016 has been used for the visualizations.
Approaches
Tools Utilized
The Tools which have been used in this analysis are :
Excel
To perform all mathematical operations and column operations to arrive at derived columns
Tableau
To derive all the visualizations
Result
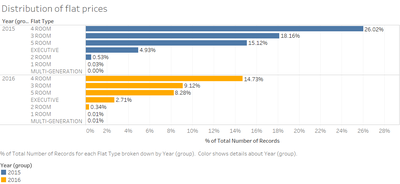
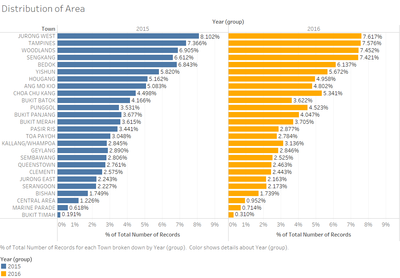
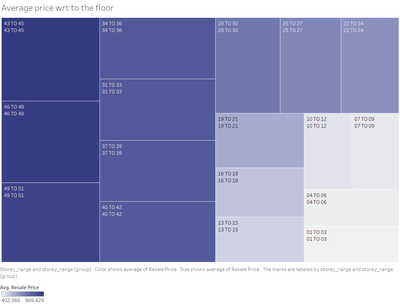
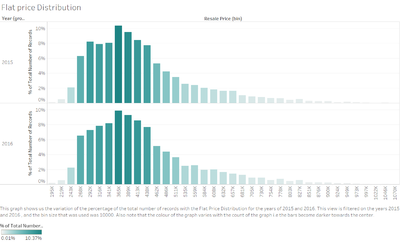
To analyze the outcomes a few info graphs were used. The distribution of flat prices, distribution area wise and the average price with respect to building height have been considered
Type of Flats
We notice that the Flat type with 4 rooms seems to be the most popular among all the HDB resold flats across both years 2015 and 2016. This value seems to be consistent irrespective of whether the HDB is a resale property or not( http://www.singstat.gov.sg/statistics/latest-data#20).Considering the fact most families in Singapore are nuclear (3-4 per family) and number of foreigners rising in Singapore(http://www.singstat.gov.sg/statistics/latest-data#20), it is evident that most extra rooms in the HDBs are being rented out.
Area Type
storey_range
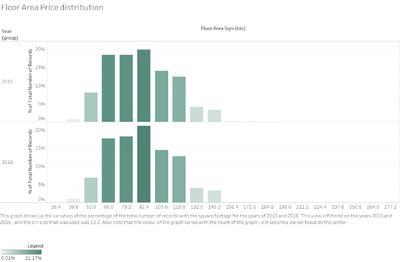
Floor Area Distribution
