ISSS608 2016-17 T1 Assign1 Mukund Krishna Ravi
Contents
ISSS608_2016-17_T1_Assign1_Mukund Krishna Ravi
Abstract
The data is about the resale price of public housing and has a wide range of information for analysis, like resale flat prices based on date of registration, town, flat type/model and lease commencement date. Distribution of resale price by town, flat type, flat model, storey range, etc. will be taken into consideration. Using the information, distribution of price and trends in first half of 2015 was compared with the first half of 2016. The results were depicted by various info graphics. This information can be utilized by any person who wants to invest in in the HDB resale properties. The data when analyzed provides a lot of insights.
Problem and Motivation
The main Problem which is faced by Singaporeans the kind of flats they should invest their money in. They could either invest in second hand property or in first hand property. This decision is carried out by analyzing various parameters.But , considering the ever increasing population(foreign and local) the number of first hand flats is on a decline. Hence the logical option in this situation would be to invest in a Second hand flat. To make an investment a person would have to analyze multiple factors such as resale value, price per square feet, the storey range etc . To understand all of this visualizations have been used. The data from the year 2015 and the early part of 2016 has been used for the visualizations.
Tools Utilized and Approches
The Tools which have been used in this analysis are :
Excel
To perform all mathematical operations and column operations to arrive at derived columns
Tableau
To derive all the visualizations
Transformation
- Conversion of Date field: The Date field of the data set was in the format YYYY-QQ and was treated as string character field by Tableau. To convert to a date format, the following formula was used on the Month column: DATEADD('month',INT(RIGHT([Month],2))-1,DATEADD('year',INT(LEFT([Month],4))-1900,#1/1/1900#)).
- Standardisation of Lease Commencement Date: The Lease Commencement Date was actually in YYYY format and was treated as string character. Conversion was done using the formula: DATEADD('year',INT([Lease Commence Date])-1900,#1/1/1900#).
New Fields
- Calculating a proxy for flat age: Given the standardisation of dates above, the age of flat can be calculated by getting the difference between transaction date and lease commencement date. The formula used was ([Year-Month]-[Lease commencement year])/365. The calculated field is rounded down to a whole number using if [Age of flat]=int([Age of flat]) then [Age of flat] elseif [Age of flat]<0 then int([Age of flat]) else int([Age of flat]+1) end.
- Calculating the price per square metre of resale prices: The prices in the resale transactions were the actual price of the whole unit. For a more detailed comparison, the prices were converted to price per square meter (psm) using [Resale Price]/[Floor Area Sqm].
- Creating a year group:A separate column showing the year grouping was created using excel using data to columns and then delimiting using '-'
Infographics
Result
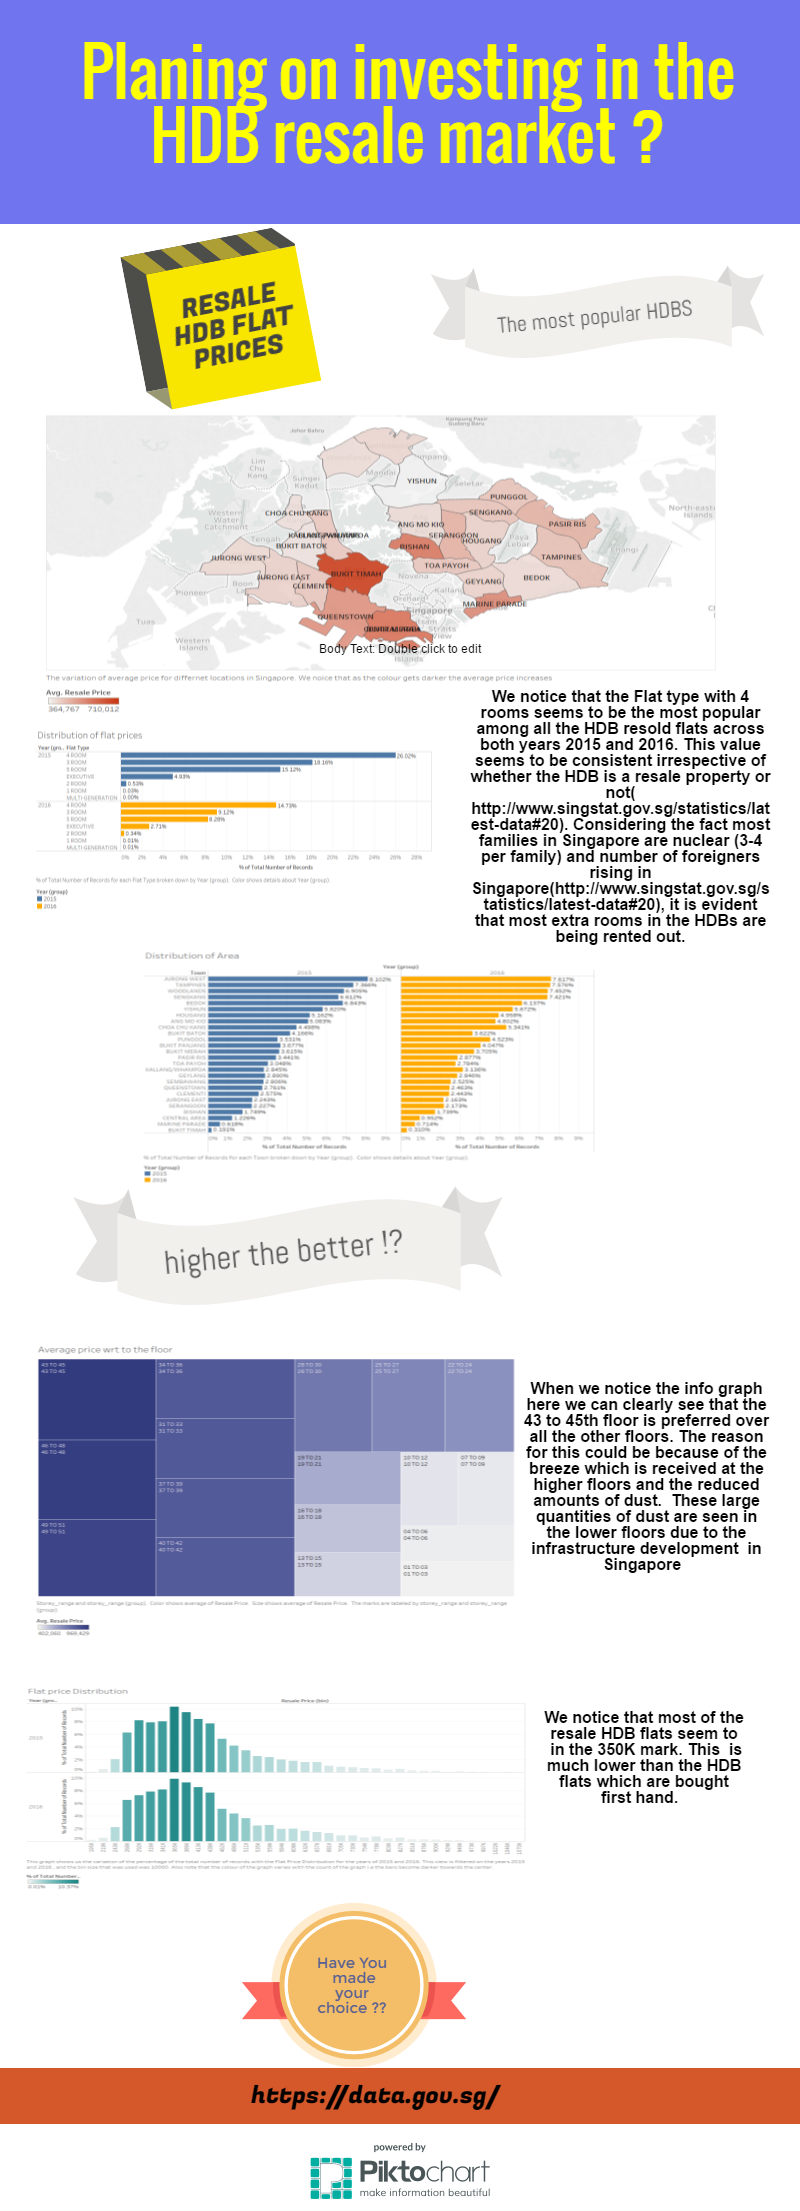
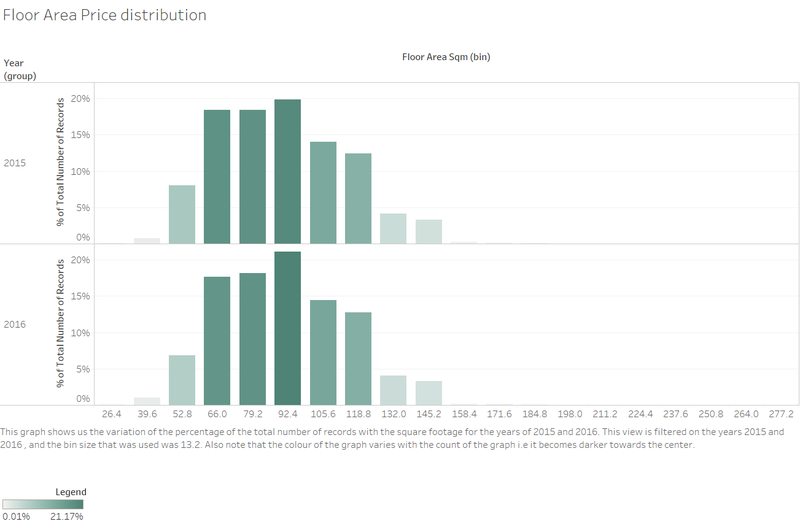
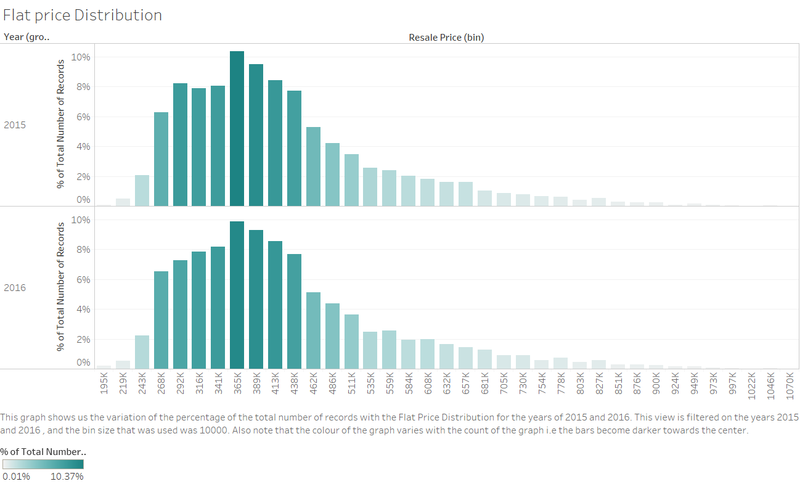
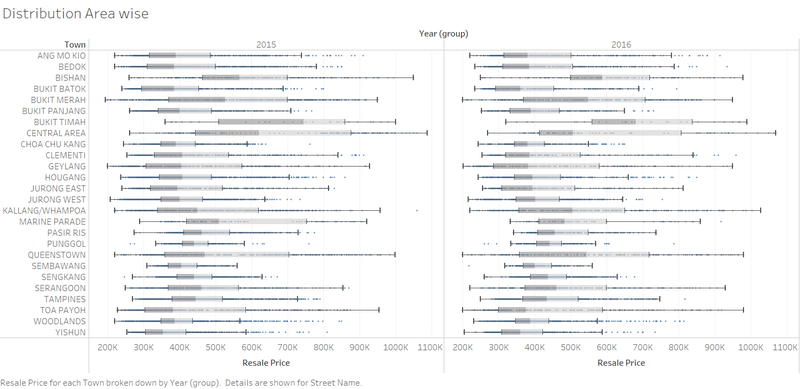
To analyze the outcomes a few info graphs were used. The distribution of flat prices, distribution area wise and the average price with respect to building height have been considered
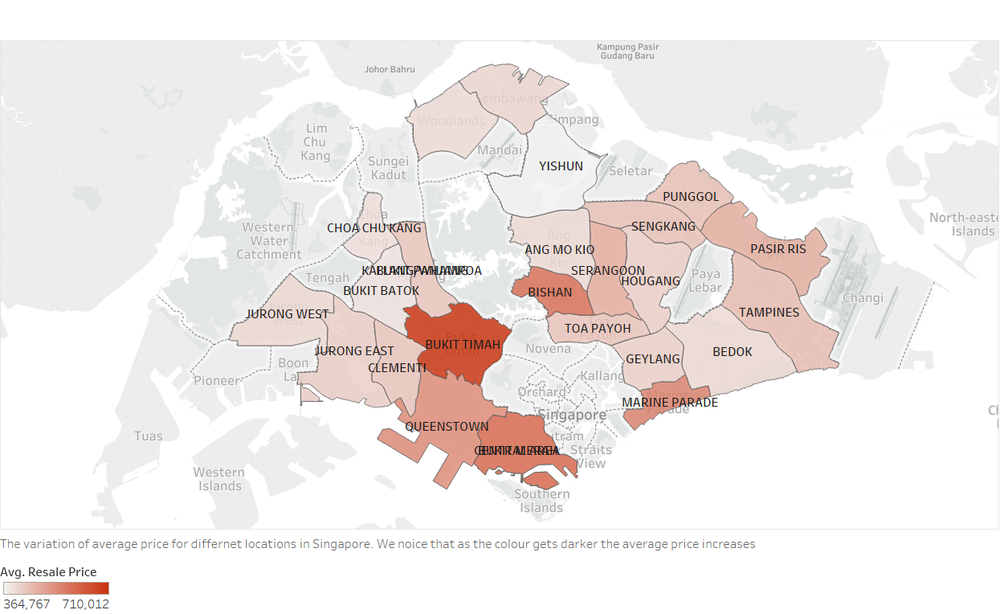
Variation in average price with respect to location
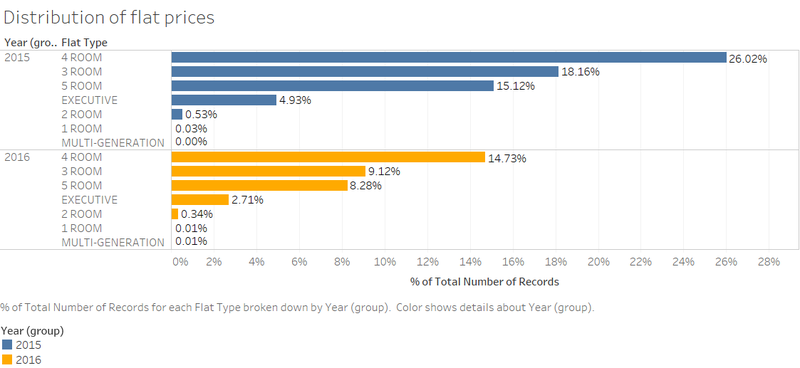
Type of Flats
We notice that the Flat type with 4 rooms seems to be the most popular among all the HDB resold flats across both years 2015 and 2016. This value seems to be consistent irrespective of whether the HDB is a resale property or not( http://www.singstat.gov.sg/statistics/latest-data#20). Considering the fact most families in Singapore are nuclear (3-4 per family) and number of foreigners rising in Singapore(http://www.singstat.gov.sg/statistics/latest-data#20), it is evident that most extra rooms in the HDBs are being rented out.
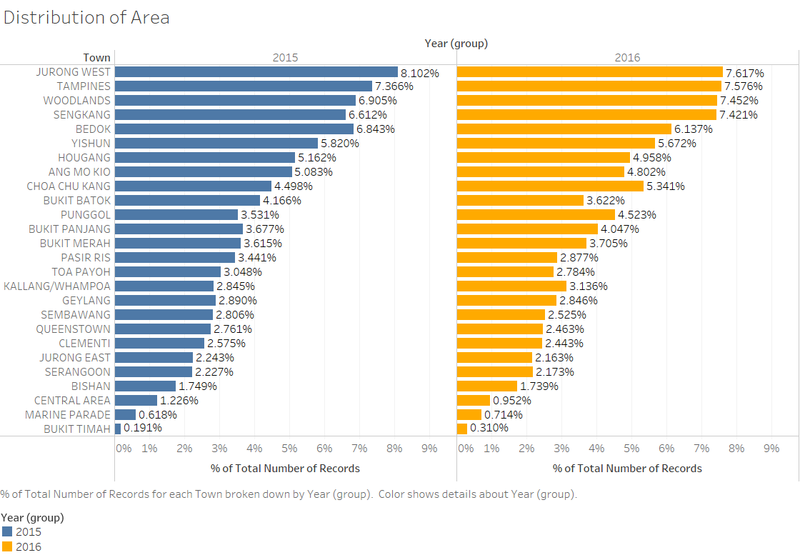
Area Type
We notice that most flats in Jurong west have the largest number of flats and the number seems to be the least Buki timah. The reason for this could be because of the proximity of bukit timah road to the CBD areas as opposed to Jurong West.
storey_range
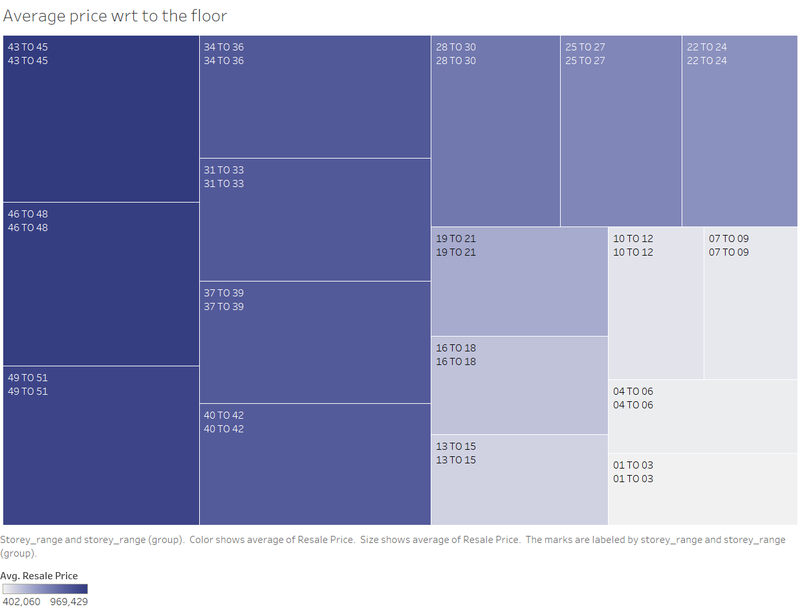
Among all the stories we notice that there is a gradual reduction in price as we move towards the lower stories. Do most Singaporeans prefer living in the higher stories ? This could be a very likely situation as Singapore is a costal city and the higher the person goes the better is the ventilation and view. Hence we notice that there is a steady increase in price as we go higher up. In the infograph the more expensive flats are represented by a darker colour
Floor Area Distribution
Resale Price Distribution
Distribution of the resale prices area wise
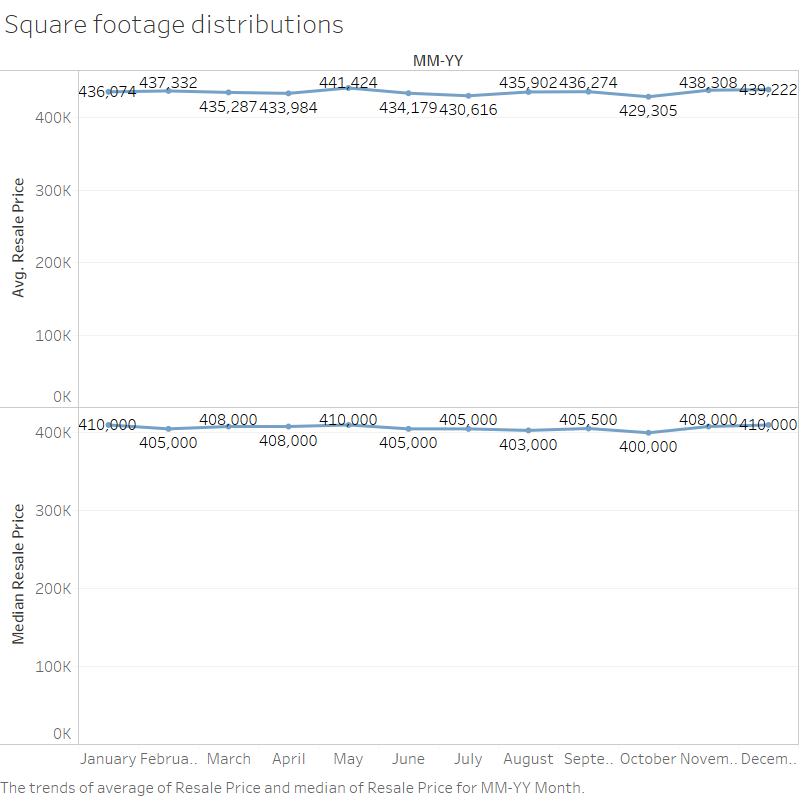
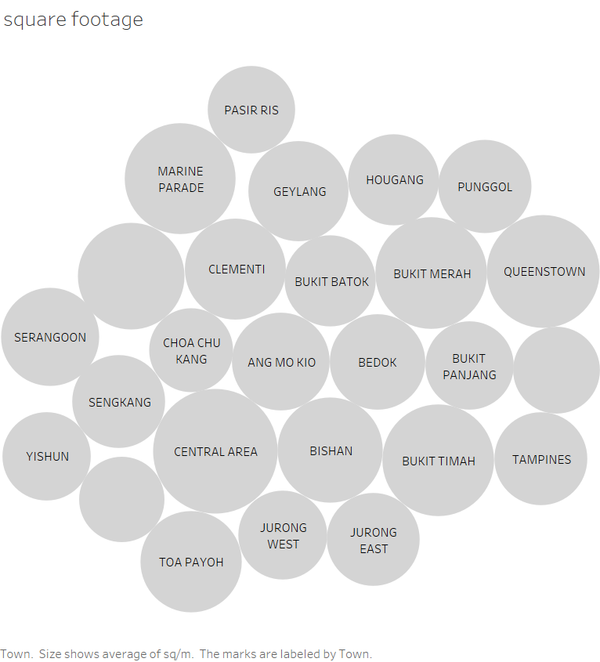
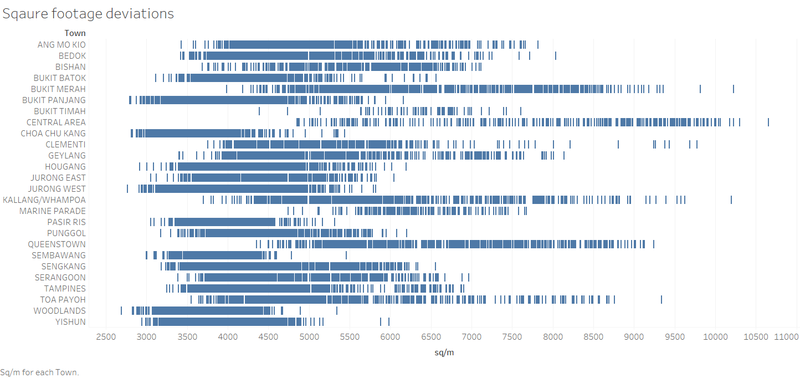
Variation in sq footage prices with respect to area
We notice that the central parts of the city seem to have the highest prices per square feet. The places which have the highest square foot price are Bishan and bukit timah. We notice that as we move to the periphery the prices seem to drop very drastically. We notice that even though bukit timah is not located in the center of the city. The reason for this could be because of the its ideal location in Singapore. It seems to be the most proximate area and the most well connected area location wise.
