ISSS608 2016-17 T1 Assign3 Wan Xulang
Contents
Abstract
During 2014, Jun, 6th to 8th, a modest-sized amusement park named DinoFun World was holding a ceremony named “Scott Jones Weekend”. However, things didn’t happen as planned before since there’s a crime was committed. While the problem was solved rapidly, park officials and law enforcement figures are interested in understanding just what happened during that weekend to better prepare themselves for future events. They are interested in understanding how people move and communicate in the park, as well as how patterns changes and evolve over time, and what can be understood about motivations for changing patterns.
Problem
In this project, basically we’ve three problems to solve, they are:
- Identify those IDs that stand out for their large volumes of communication. For each of these IDs:
- Characterize the communication patterns you see.
- Based on these patterns, what do you hypothesize about these IDs? Note: Please limit your response to no more than 4 images and 300 words.
- Describe up to 10 communications patterns in the data. Characterize who is communicating, with whom, when and where. If you have more than 10 patterns to report, please prioritize those patterns that are most likely to relate to the crime. Note: Please limit your response to no more than 10 images and 1000 words.
- From this data, can you hypothesize when the vandalism was discovered? Describe your rationale. Note: Please limit your response to no more than 3 images and 300 words.
Data Introduction & Preparation
Introduction
In this project, we are provided the movement and communication data for each person in this park within these three days. However, the size of these data sets is quite big for a personal laptop. So in further analysis, we may do some necessary reduction of these data sets. In the preparation part, we may only cover some basic solutions while we'll give further descriptions in specific approaches if needed.
Preparation
During the preparation, we should do these things first:
- Respectively, merge the data of communication and movement of different days together.
- Change two columns' name of communication data to source and target which will be helpful in doing network analysis.
As shown above, we'll get something like this. For other small changes in analysis part, we may not cover them here.
Approaches
Task-1
To find out significant IDs and characterize them, we may first try to figure out those IDs with large volume of messages. So we calculate the distribution of sending and receiving messages among each person respectively.
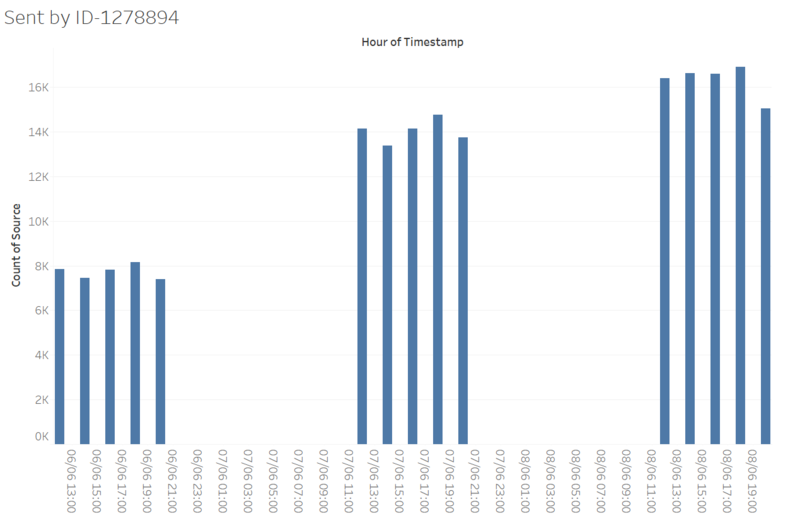
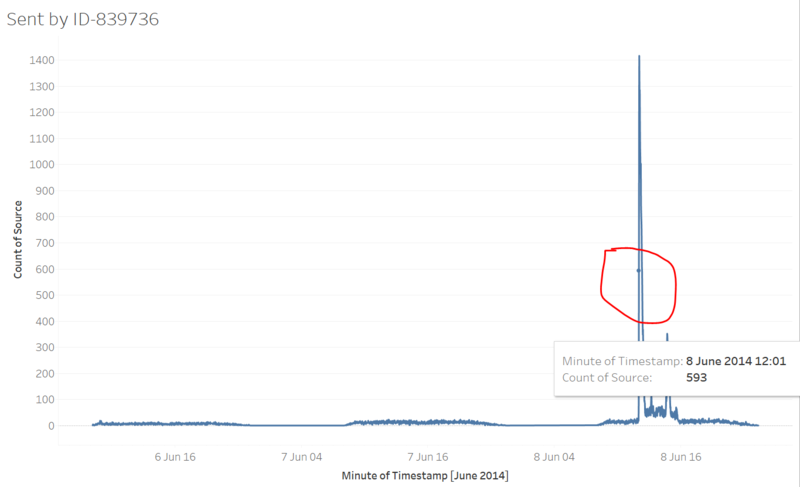
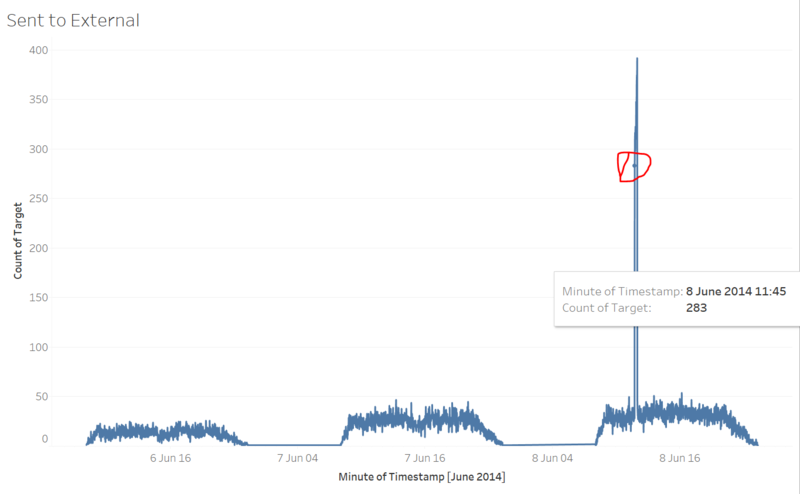
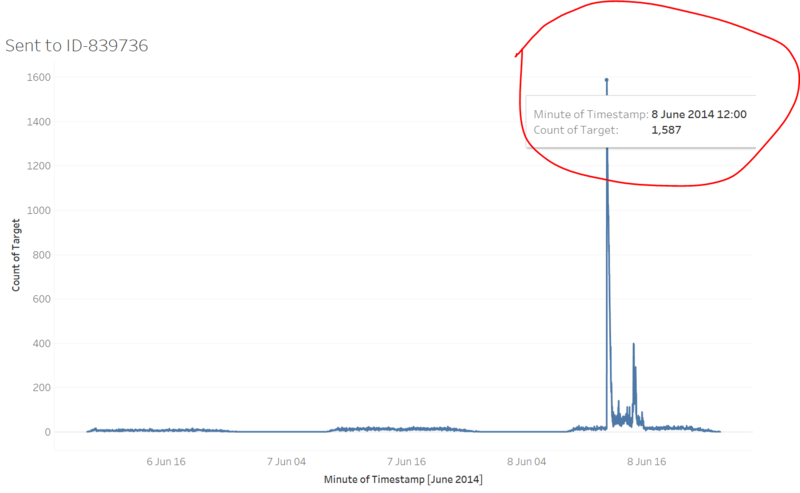
As shown above, basically we can have three significant IDs here: 839736, 1278894 and external. However, we may not concern about ‘external’ here for a while. So, to get better understanding of ID-1278894 and ID-839736, we may try to mine their active patterns first. Basically, we would try to find their communication activities according to the time.
Task-2
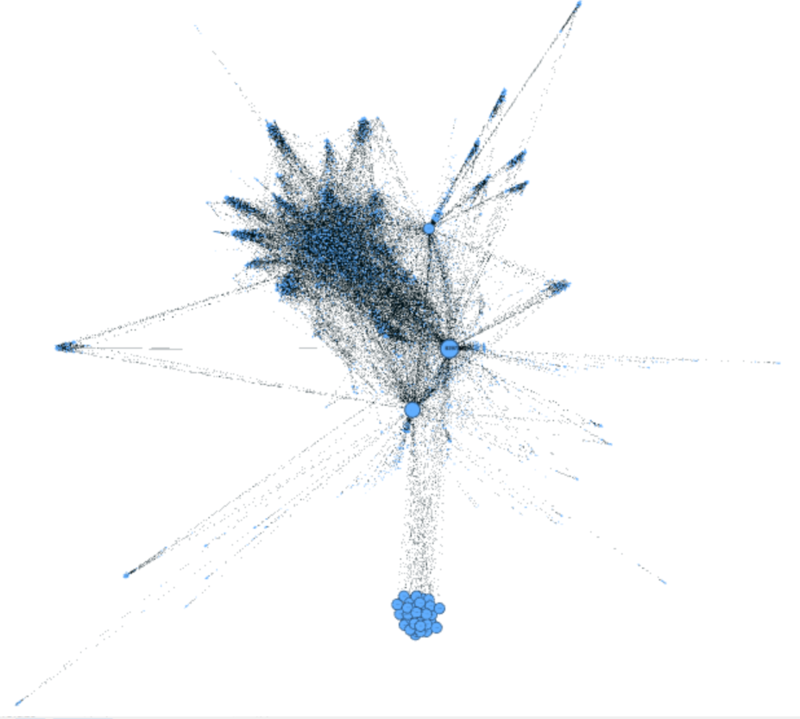
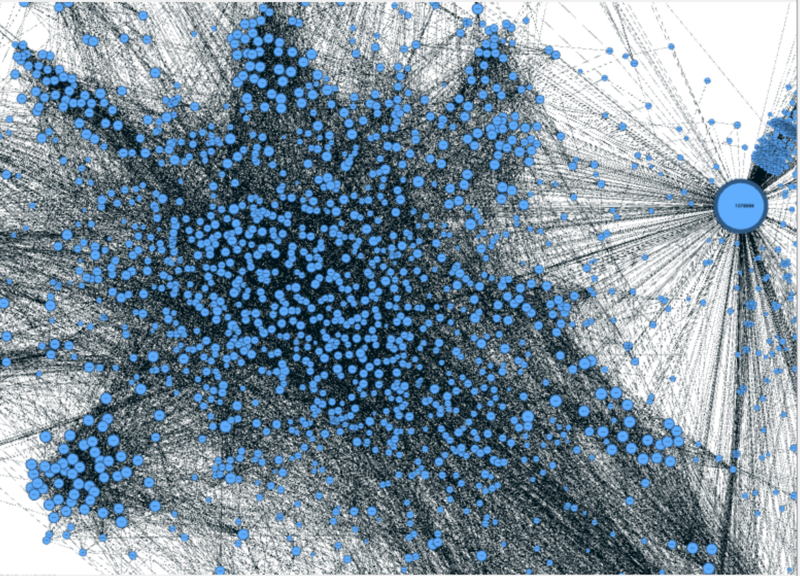
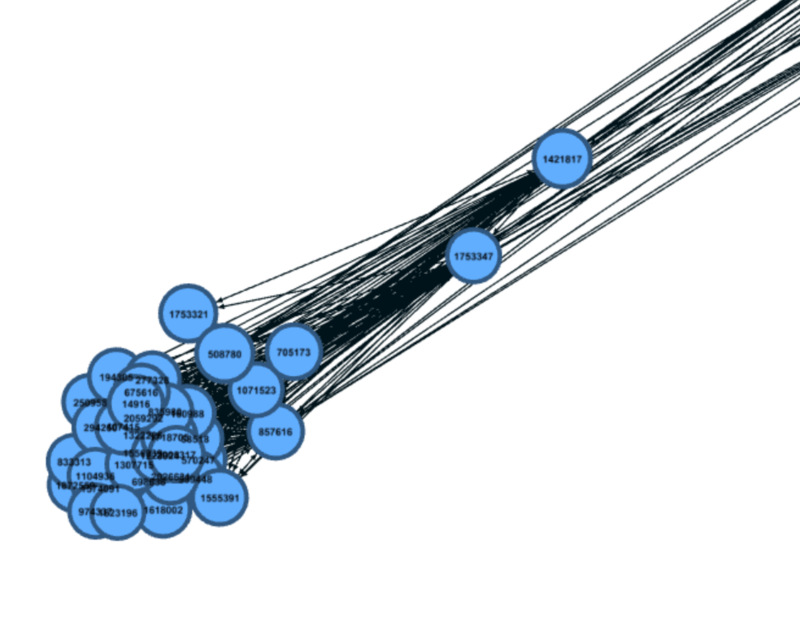
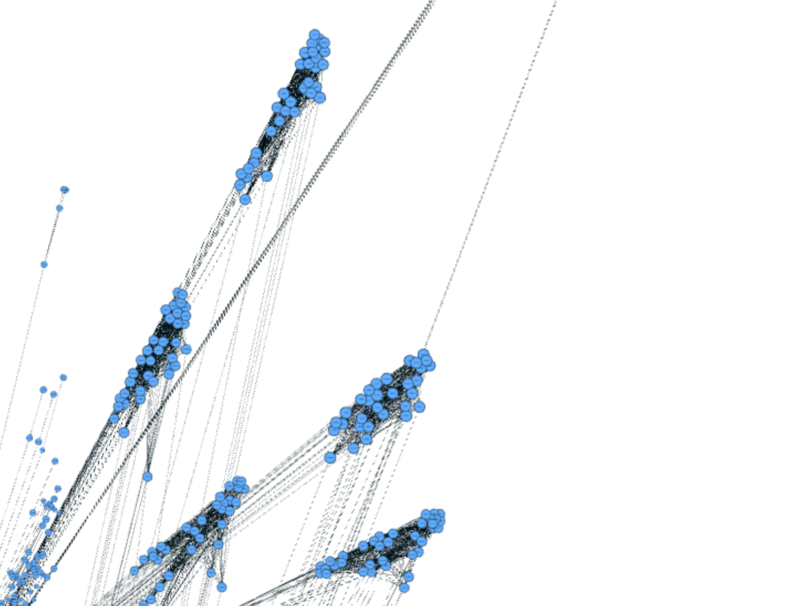
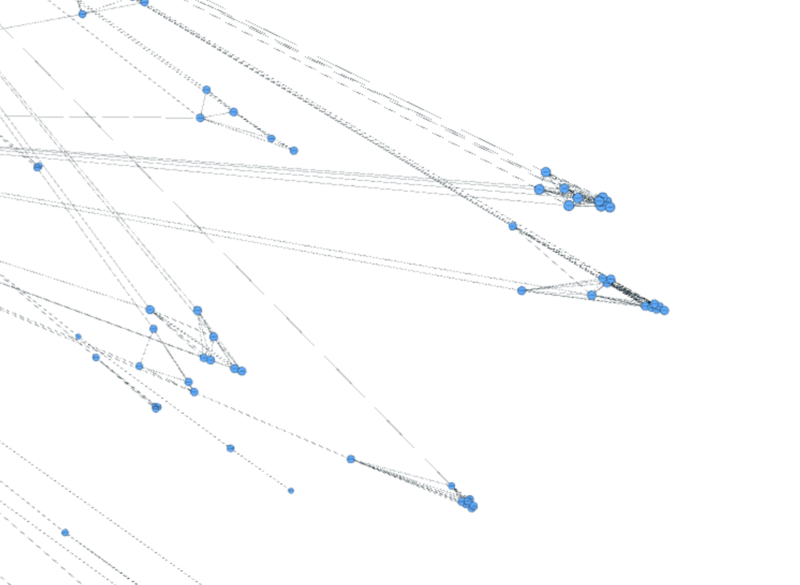
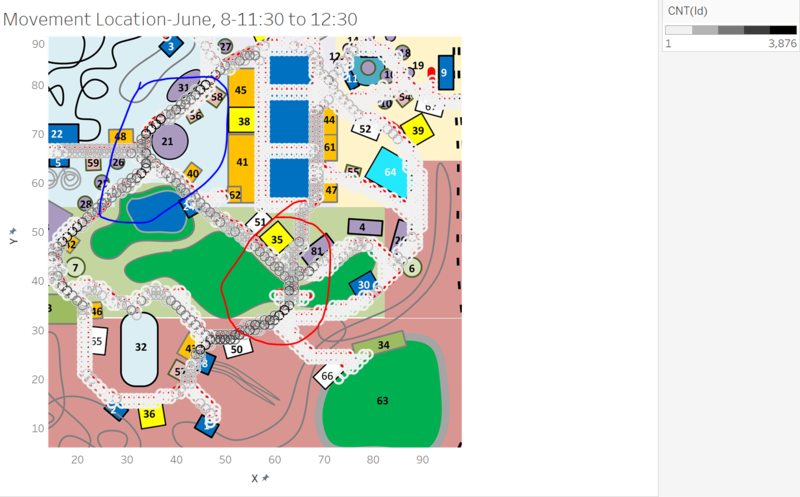
11:30 to 12:30 eigenvector centrality force atlas
Task-3
https://public.tableau.com/profile/xulang.wan#!/vizhome/MovementMap_0/Dashboard1
Conclusion & Summary
Tool Utilized
Software: JMP Pro, Tableau and Gephi
