ISSS608 2016-17 T1 Assign3 Wan Xulang
Contents
Abstract
During 2014, Jun, 6th to 8th, a modest-sized amusement park named DinoFun World was holding a ceremony named “Scott Jones Weekend”. However, things didn’t happen as planned before since there’s a crime was committed. While the problem was solved rapidly, park officials and law enforcement figures are interested in understanding just what happened during that weekend to better prepare themselves for future events. They are interested in understanding how people move and communicate in the park, as well as how patterns changes and evolve over time, and what can be understood about motivations for changing patterns.
Problem
In this project, basically we’ve three problems to solve, they are:
- Identify those IDs that stand out for their large volumes of communication. For each of these IDs:
- Characterize the communication patterns you see.
- Based on these patterns, what do you hypothesize about these IDs? Note: Please limit your response to no more than 4 images and 300 words.
- Describe up to 10 communications patterns in the data. Characterize who is communicating, with whom, when and where. If you have more than 10 patterns to report, please prioritize those patterns that are most likely to relate to the crime. Note: Please limit your response to no more than 10 images and 1000 words.
- From this data, can you hypothesize when the vandalism was discovered? Describe your rationale. Note: Please limit your response to no more than 3 images and 300 words.
Data Introduction & Preparation
Introduction
In this project, we are provided the movement and communication data for each person in this park within these three days. However, the size of these data sets is quite big for a personal laptop. So in further analysis, we may do some necessary reduction of these data sets. In the preparation part, we may only cover some basic solutions while we'll give further descriptions in specific approaches if needed.
Preparation
During the preparation, we should do these things first:
- Respectively, merge the data of communication and movement of different days together.
- Change two columns' name of communication data to source and target which will be helpful in doing network analysis.
As shown above, we'll get something like this. For other small changes in analysis part, we may not cover them here.
Approaches
Task-1
To find out significant IDs and characterize them, we may first try to figure out those IDs with large volume of messages. So we calculate the distribution of sending and receiving messages among each person respectively.
As shown above, basically we can have three significant IDs here: 839736, 1278894 and external. However, we may not concern about ‘external’ here for a while. So, to get better understanding of ID-1278894 and ID-839736, we may try to mine their active patterns first. Basically, we would try to find their communication activities according to the time.
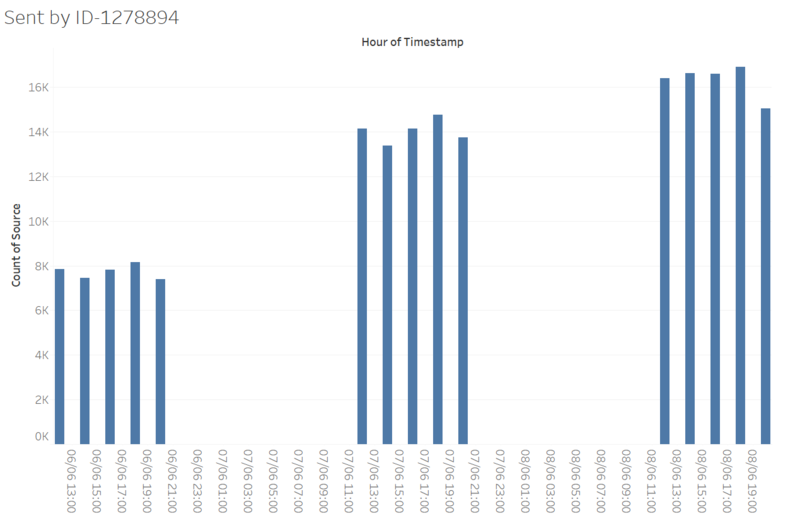
As shown above, we find that, ID-1278894 always keep a large volume of sending message during these days. We see that, within one day, the volumes of communications of different time are almost the same. It seems that ID-1278894 is sending messages from 8:00 am to 21:00 pm every day and never feel tired.
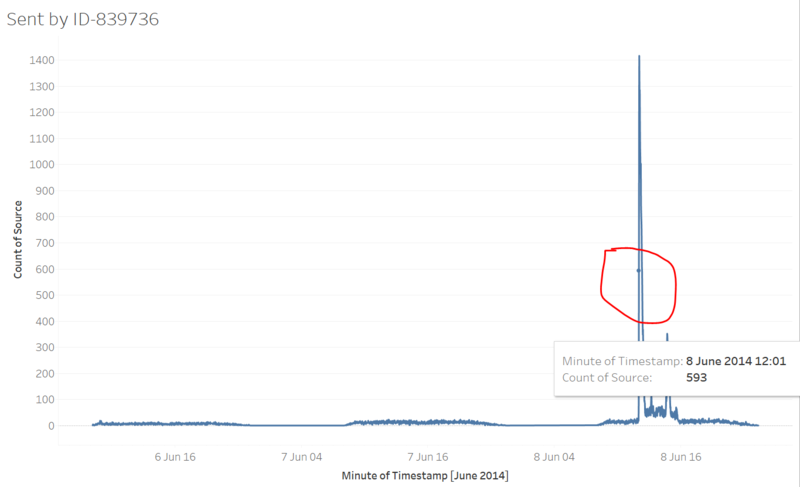
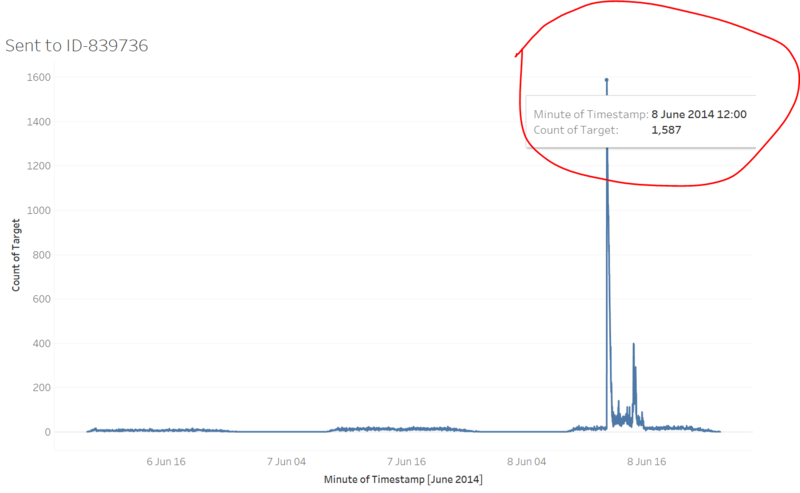
Compare with ID-1278894, ID-839736 also sending messages from 8:00 am to 21:00 pm everyday while the volume is not that huge. An interesting point is that there’s peak time on the third day which began from June, 8th 12:01 which is marked by a red circle in the graph. However, we should take note of this since it will be very helpful for further analysis.
In the last stage, we may take a look about the location when these two people are sending messages. As shown above, they sent all their messages in the entry corridor which implies that they never leave this place during these three days! So, based what we’ve found above, we have such assumptions of these two IDs.
- ID-1278894 is an automatic message sender which is developed by the part. It’s used to send necessary information to all the people in the park.
- ID-839736 is a kind of official person of this park. He always sit in the entry corridor and send messages manually when needed.
Task-2
In this part, we are trying to find communication patterns for different groups of people. With the limitation of my personal laptop, I just picked out the communication data from June, 8th 11:30 am to 12:30 am which is highly relevant to the crime happened in this park. The software we are using is Gephi which can help us to build the network map according to the sample set.
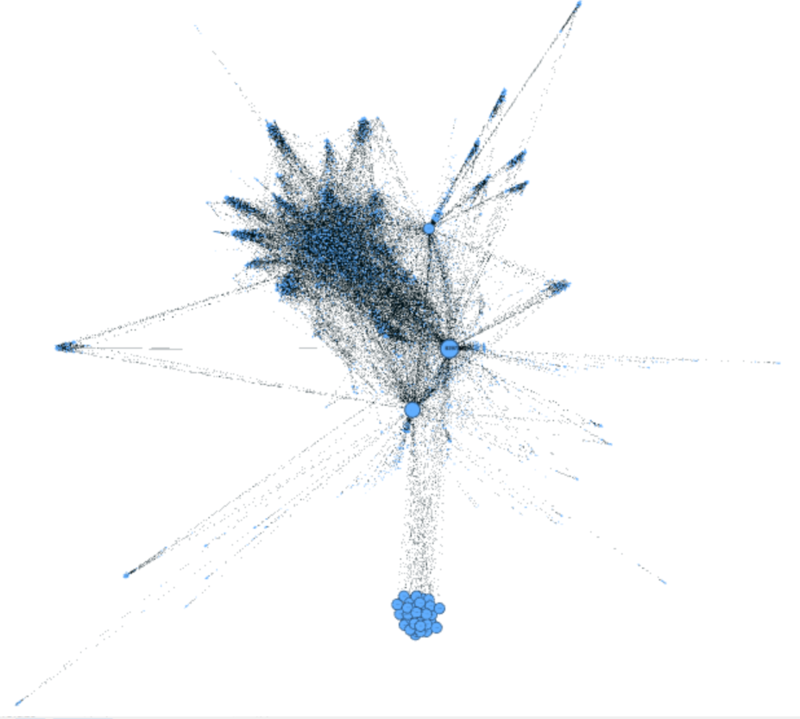
This graph has shown an overall map of all people in this park. The method we use to build it is Force Atlas while the eigenvector centrality is used to control the size of each node in the network map. For significant patterns, we'll talk about them one by one later.
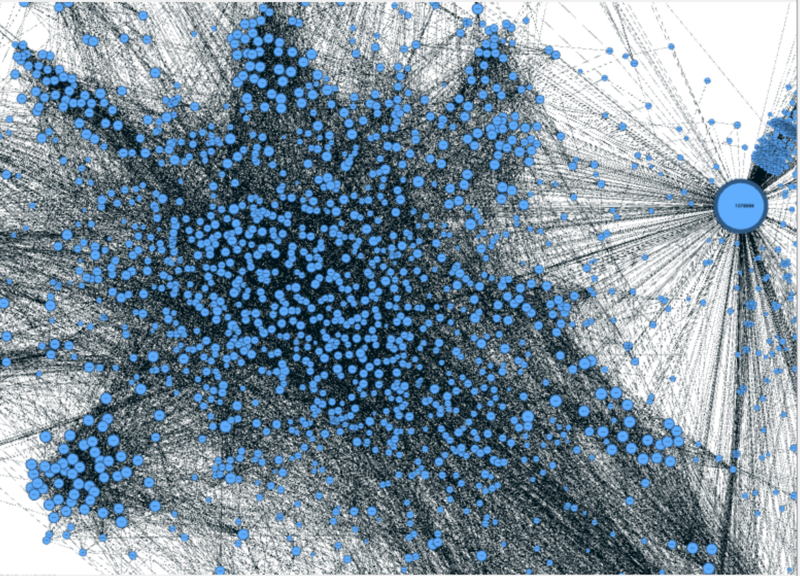
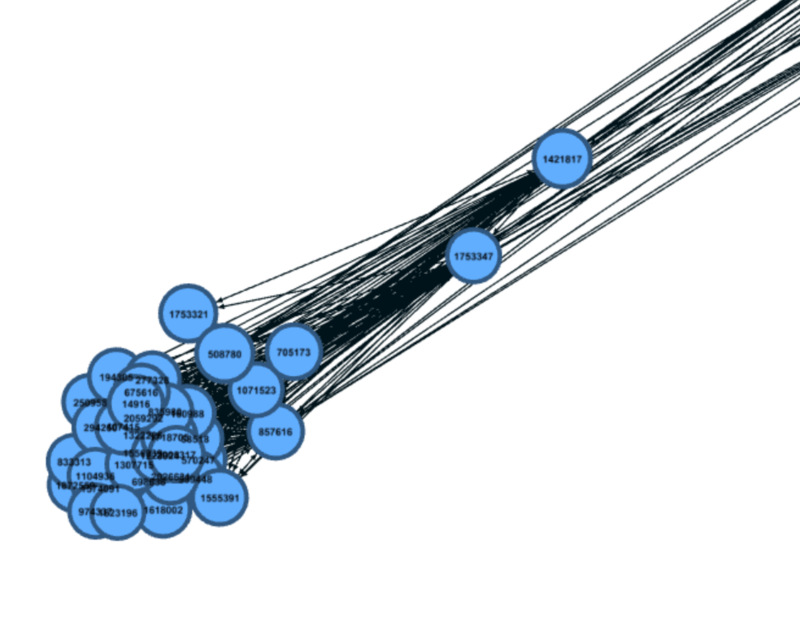
The first pattern is named “normal human”. During the time of the crime, these points have high linkages with each other, and they are very close to each other. For every single point, the size is almost in a same level which means the importance of them to the network map are almost the same. This pattern represents to normal tourist in the park. When something happened, they receive information from ID-1278894 and ID-839736 then discuss with each other and send message to external
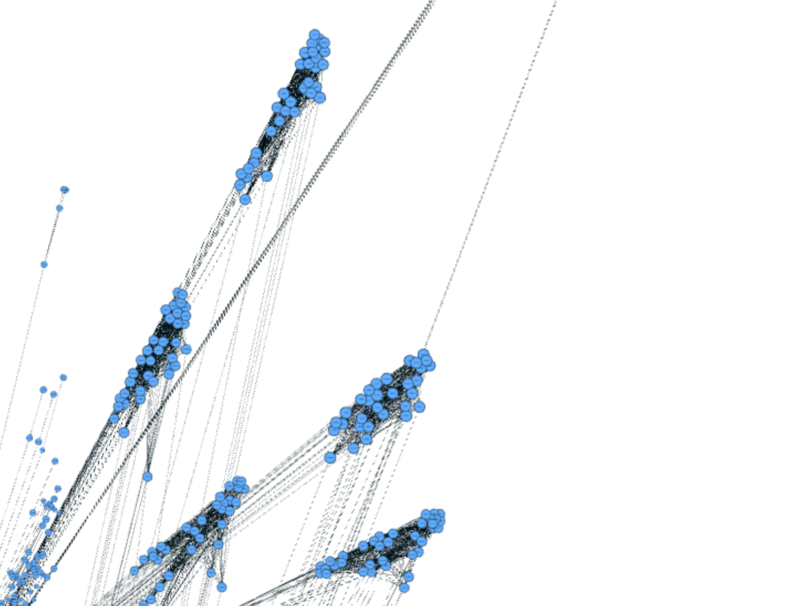
The second pattern is named “travel group”. There are quite a lot travel groups in the map while we’ve shown one of them above. They have some significant features:
- For each group, there’s leader. Other group members will communicate to outside through the leader.
- Within the group, members have high volume of communications to each other and they are very closed.
- Except communicating though the leader, members do not have many communications to outside nodes.
Based on these observations, we can assume that this pattern represents to some travelling groups like a teacher with many students or tour guide with many tourists.
The third one is named “normal group”. They are also groups of people who are very closed to each other. Compare with travel group, they have such different features:
- For one group, members don’t need to communicate to outside world through a certain person.
- Members in one group also don’t have too many communications to the outside world. Most of their communications to the outside world are link with ID-1278894, ID-839736 and external.
In my assumption, these groups represents to batch of travellers. They are highly related to each other like friends and they need a tour guide to lead them. An interesting example is that they are groups of teenagers, independent enough but still need people to accompany.
The fourth one is named “lonely pair”. Compare with previous patterns, they are like small size normal groups. In the perspective of communication, they are similar to normal group while they are much smaller. Usually, there’s only 2 to 5 people in one lonely pair. This pattern represents to a family or a couple of lovers since they are alone, independent and highly closed to each other.
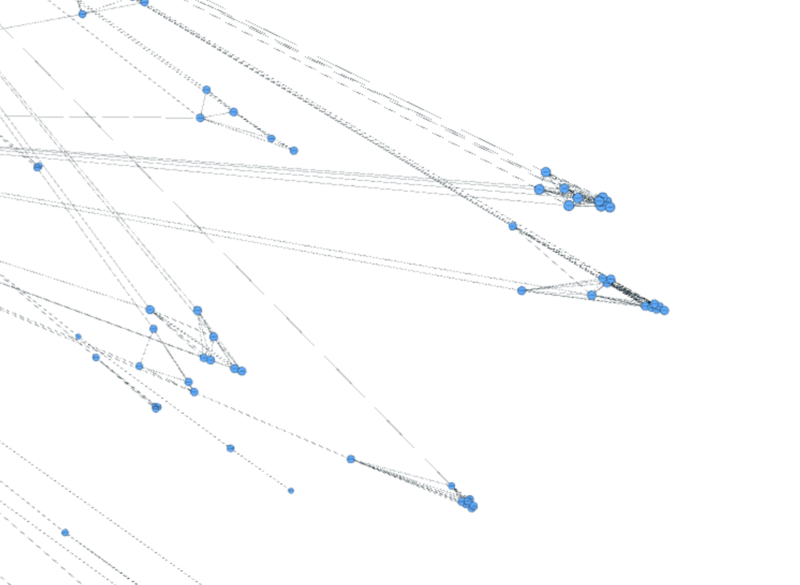
The last pattern is a singularity group named “Officials” in the network. Members have high importance to the network and highly closed to each other. The very important point is that they do not have any communications with ID-1278894 which is the AI message sender. Their communications are mainly with external or ID-839736. So a reasonable assumption is that they are official people who are in charge of this park. As we only take the data around the time when crime happened, they are important to the network and only communicate to ID-839736 to solve the problem. This can also support the assumption we’ve given before that ID-839736 is an official person of this park.
Task-3
Based on our assumptions given before, we’ll do further analysis to find when and where the crime was found.
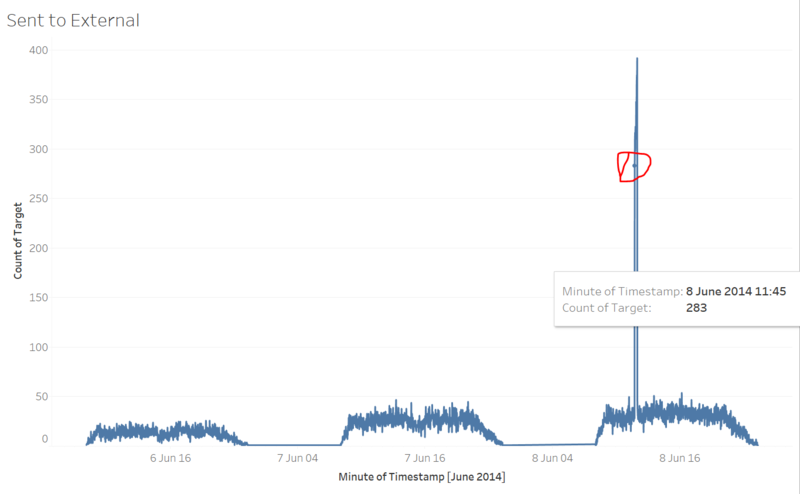
As shown above, number messages sent to external always keeps in a same level along the time. But there’s a strange peak happened from Jun, 8th 11:45 am which is marked by red circle in the graph. An assumption is that, when people find there’s a crime, they try to send messages to external to let other people know this.
Then we should take a look about the number of messages sent to ID-839736 who’s the official person in the park. The situation is quite similar compare with previous graph. There’s a peak happened from Jun, 8th 12:00 am. When people find crimes happen, they may tell two kinds of people, their friends or the official who is in charge. Do you still remember a graph we’ve shown in task-1? The number of messages sent by ID-839736 along the time. There’s also a peak which is exactly happed from Jun, 8th 12:01 am, just one minute after the peak here! We can imagine, after ID-839736 was told about the crime, he rapidly begin to send messages to people in the park and other officials! So based on these analysis, we can give a range to when did the crime was founded. It’s exactly between Jun, 8th 11:45 am to 12:00 am.
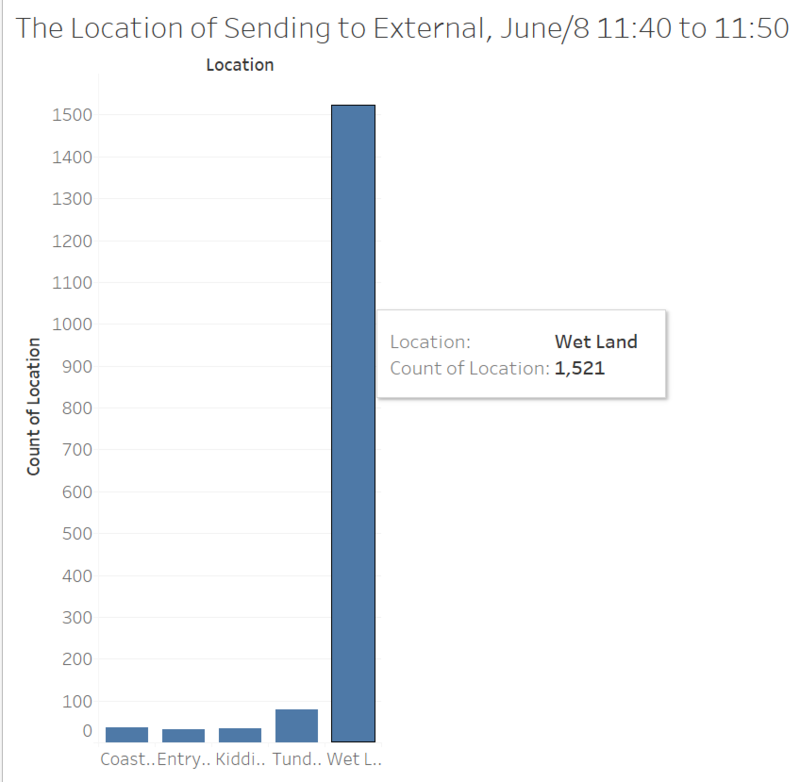
After defining the time range, we’ll analysis about the location. As shown above, between 11:40 am and 11:50 am which is the peak duration of sending messages to external. Most of the messages were sent in the wet land. Combine with previous visualizations, we have a first level location – Wet Land.
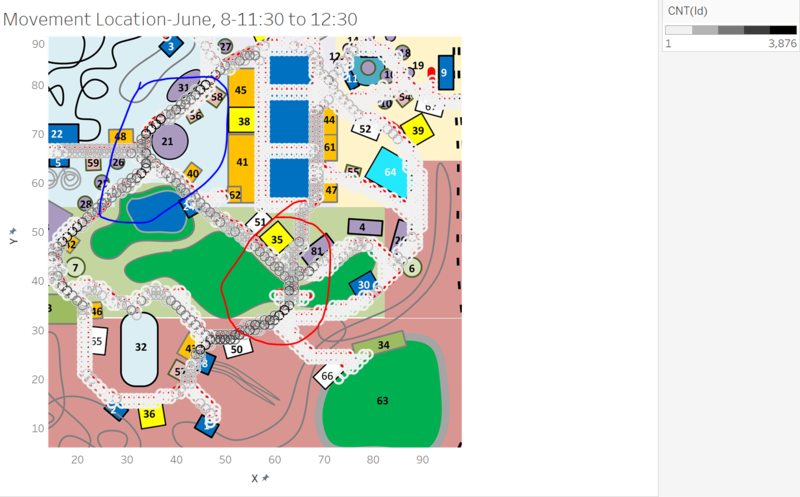
Then we use the movement data to build a visualization map as shown above. The time range is between 11:30 am and 12:30 am which is 1 hour around the crime was found. In this movement map, two significant areas were circled by blue and red. Within the time range, movement of these two areas are much significant than other places. Combine with the first level location which is Wet Land, we think the red circle is more probably where the crime is found.
And this public Tableau work sheet may give you a much more clear understanding of the movement flow in this time duration: https://public.tableau.com/profile/xulang.wan#!/vizhome/MovementMap_0/Dashboard1 (You may want to download it to local system since it moves quite slow in the cloud.)
Conclusion & Summary
After our analysis, we have two main takeaways:
- There five patterns of communications in the park during the time when the crime was found. The further description and features for each pattern was written before in the task-2 module for you to have a reference.
- The crime is found between Jun, 8th 11:45 am to 12:00 am. The location is in the Wet land and the bridge(or middle or road) of No.30 place in the map. The detail analysis and inference can be found in the task-3 module.
Tool Utilized
Software: JMP Pro, Tableau and Gephi
