Difference between revisions of "ISSS608 2016-17 T1 Assign2 Frandy Eddy"
| Line 14: | Line 14: | ||
= Theme of Interest = | = Theme of Interest = | ||
| − | It is interesting to analyse the survey results on teaching uses of Wikipedia and see if | + | It is interesting to analyse the survey results on teaching uses of Wikipedia and see if we can get any insights from the data. I am also keen to explore the relationships between the various attributes of the respondent and their assessment. The data can be obtained from [https://archive.ics.uci.edu/ml/datasets/wiki4HE]. From the data, there are some questions that we would like to investigate further. |
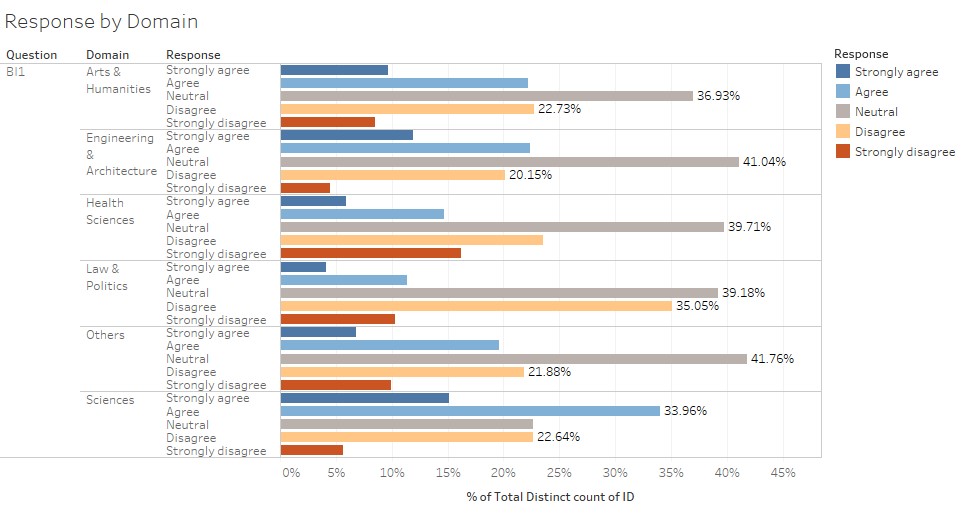
| − | * | + | * How do respondents from different domains rate their behavioral intention on Wikipedia? |
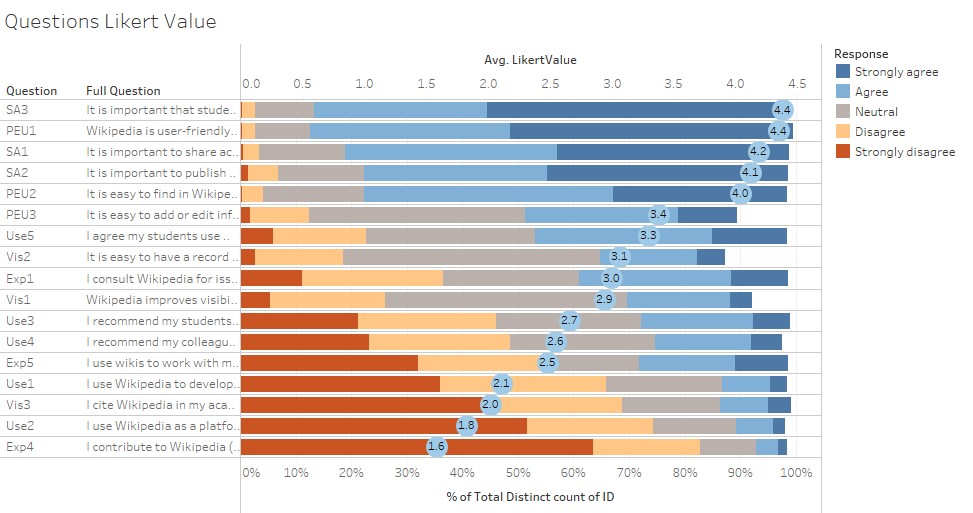
| − | * | + | * Which question or statement has the highest agreement or highest average Likert value? |
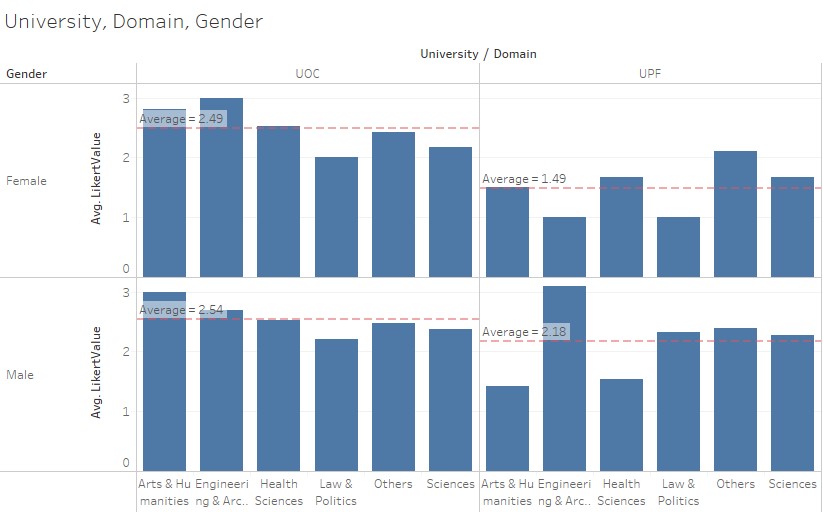
| − | * | + | * Which universities, domain, or gender have higher tendency to use wiki to work with the students? |
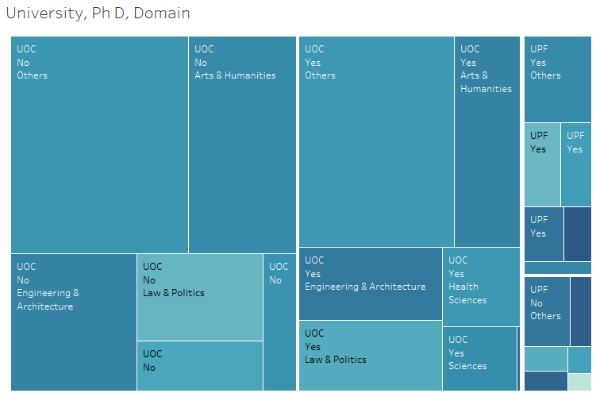
| − | * | + | * How do respondents with or without PhD from different universities and domains rate their agreement on consulting Wikipedia for issues related to their field of expertise? |
== Data Preparation == | == Data Preparation == | ||
| Line 38: | Line 38: | ||
[[File:Response by Domain Frandy.jpg]] | [[File:Response by Domain Frandy.jpg]] | ||
| − | + | As can be seen from the graph, respondents from Arts & Humanities, Engineering & Architecture, Health Sciences domain have quite a similar distribution in terms of their response to the statement "In the future I will recommend the use of Wikipedia to my colleagues and students". The response is normally distributed with "Neutral" having the highest frequency and both "Strongly agree" & "Strongly disagree" having the lowest frequency. The interesting observation here is respondents from Law & Politics and Sciences domain. Respondents from Law & Politics domain have a high percentage of Disagree (35.05%), while respondents from Sciences domain have a high percentage of Agree (33.96%). This shows that people from the Sciences domain tend to recommend the use of Wikipedia to their colleagues and students, while people from the Law & Politics tend not to. | |
[[File:Questions Likert Value Frandy.jpg]] | [[File:Questions Likert Value Frandy.jpg]] | ||
Revision as of 04:46, 26 September 2016
Contents
Abstract
Wikipedia is. Survey of faculty members from two Spanish universities on teaching uses of Wikipedia
Problem and Motivation
Problem:
- What are the
- What are the
Theme of Interest
It is interesting to analyse the survey results on teaching uses of Wikipedia and see if we can get any insights from the data. I am also keen to explore the relationships between the various attributes of the respondent and their assessment. The data can be obtained from [1]. From the data, there are some questions that we would like to investigate further.
- How do respondents from different domains rate their behavioral intention on Wikipedia?
- Which question or statement has the highest agreement or highest average Likert value?
- Which universities, domain, or gender have higher tendency to use wiki to work with the students?
- How do respondents with or without PhD from different universities and domains rate their agreement on consulting Wikipedia for issues related to their field of expertise?
Data Preparation
Before we start to do the analysis, we need to clean the data so that it can be used for analysis.
- It is found that there are some "?" values for some attributes. As we don't know the exact value for these attributes, we will leave it as blank by replacing the "?" values with "" (blank) value.
- An additional ID column is assigned to each respondent to help in the data visualization.
- To be able to visualize the survey results in Tableau, we need to reshape the data so that each question has one row.
- Another column is created to specify the full questions to help the reader to understand the question.
- I also used the "Edit Alias" function in Tableau to rename the attributes according to the information given.
Tools Utilized
Tableau 10.0 is used for visualization of the data. JMP Pro 12 and Microsoft Excel are used for data preparation.
Results
Here are some of the results based on the questions that we have defined.

As can be seen from the graph, respondents from Arts & Humanities, Engineering & Architecture, Health Sciences domain have quite a similar distribution in terms of their response to the statement "In the future I will recommend the use of Wikipedia to my colleagues and students". The response is normally distributed with "Neutral" having the highest frequency and both "Strongly agree" & "Strongly disagree" having the lowest frequency. The interesting observation here is respondents from Law & Politics and Sciences domain. Respondents from Law & Politics domain have a high percentage of Disagree (35.05%), while respondents from Sciences domain have a high percentage of Agree (33.96%). This shows that people from the Sciences domain tend to recommend the use of Wikipedia to their colleagues and students, while people from the Law & Politics tend not to.
A
A
A
Link to Tableau Public :
Dashboard 1[2]
Dashboard 2[3]
Dashboard 3[4]
References
http://www.datarevelations.com/using-tableau-to-visualize-survey-data-part-1.html
http://www.datarevelations.com/using-tableau-to-visualize-survey-data-part-2.html


