ISSS608 2016-17 T1 Assign2 Frandy Eddy
Contents
Abstract
Wikipedia is very popularly used by people from different backgrounds for different purposes. This assignment aims to assess the use of Wikipedia as a teaching resource. The dataset provided for this assignment have the information about the survey of faculty members from two Spanish universities on teaching uses of Wikipedia.
Theme of Interest and Motivation
It is interesting to analyse the survey results on teaching uses of Wikipedia and see if we can get any insights from the data. I am also keen to explore the relationships between the various attributes of the respondent and their assessment. The data can be obtained from [1]. From the data, there are some questions that we would like to investigate further.
- How is the distribution of age of respondents who take part in the survey?
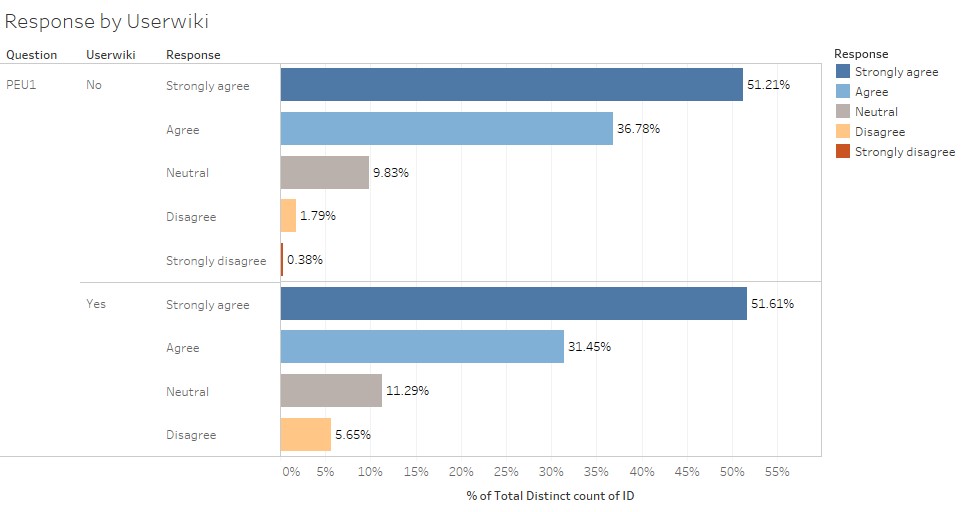
- Is there a difference in the rating given by a registered and non-registered Wikipedia user about the user-friendliness of Wikipedia?
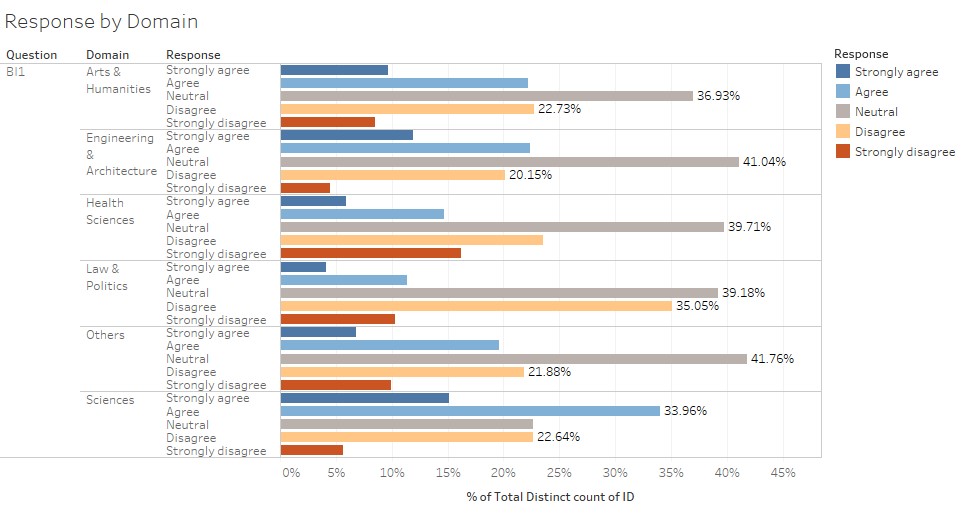
- How do respondents from different domains rate their behavioral intention on Wikipedia?
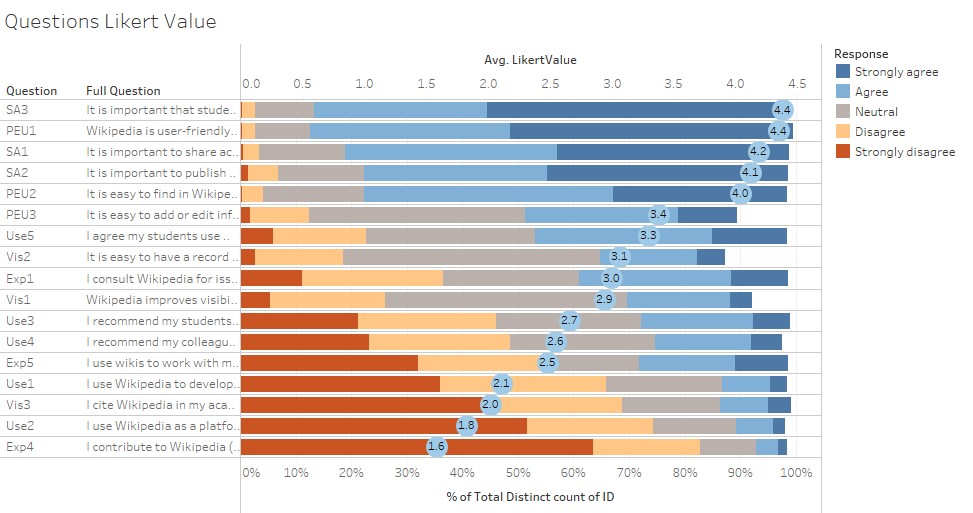
- Which question or statement has the highest agreement or highest average Likert value?
- Which aspect or group of question has the highest and lowest average Likert value?
- Which universities, domain, or gender have higher tendency to use wiki to work with the students?
- How do respondents with or without PhD from different universities and domains rate their agreement on consulting Wikipedia for issues related to their field of expertise?
Data Preparation
Before we start to do the analysis, we need to clean the data so that it can be used for analysis. The data cleaning is mostly done on Microsoft Excel.
- It is found that there are some "?" values for some attributes. As we don't know the exact value for these attributes, we will leave it as blank by replacing the "?" values with "" (blank) value.
- An additional ID column is assigned to each respondent to help in the data visualization.
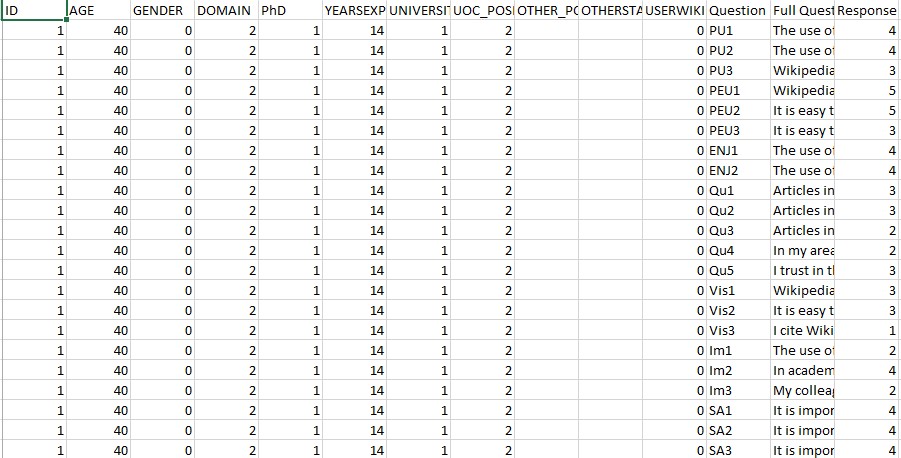
- To be able to visualize the survey results in Tableau, we need to reshape the data so that each question has one row.
- Another column is created to specify the full questions to help the reader to understand the question. The prepared, reshaped, and cleaned data can be seen below.
- I also used the "Edit Alias" function in Tableau to rename the attributes according to the information given.
Tools Utilized
Tableau 10.0 is used for visualization of the data. JMP Pro 12 and Microsoft Excel are used for data preparation.
Results
Here are some of the results based on the questions that we have defined.
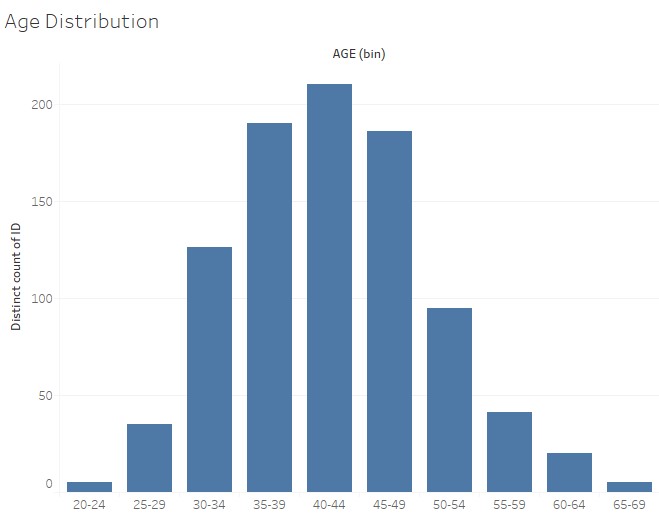
The distribution of the age of the respondents are normally distributed with age group 40-44 having the highest frequency (23%).
Interestingly, non-registered Wikipedia user have a higher agreement on the statement "Wikipedia is user-friendly", as can be seen from the graph above.
As can be seen from the graph, respondents from Arts & Humanities, Engineering & Architecture, Health Sciences domain have quite a similar distribution in terms of their response to the statement "In the future I will recommend the use of Wikipedia to my colleagues and students". The response is normally distributed with "Neutral" having the highest frequency and both "Strongly agree" & "Strongly disagree" having the lowest frequency. The interesting observation here is respondents from Law & Politics and Sciences domain. Respondents from Law & Politics domain have a high percentage of Disagree (35.05%), while respondents from Sciences domain have a high percentage of Agree (33.96%). This shows that people from the Sciences domain tend to recommend the use of Wikipedia to their colleagues and students, while people from the Law & Politics tend not to.
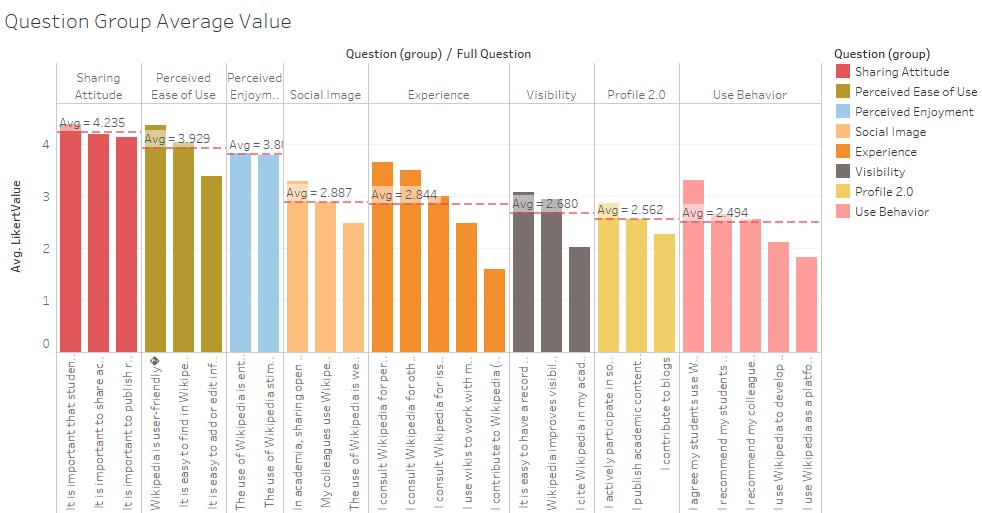
The question or statement which has the highest average Likert value is about the Sharing Attitude (SA) with all the three questions having an average Likert value of greater than 4.0. More than 75% of the respondents give a rating of 4 or 5 for all the three questions about Sharing Attitude.
- SA1: It is important to share academic content in open platforms has an average Likert value of 4.2
- SA2: It is important to publish research results in other media than academic journals or books has an average Likert value of 4.1
- SA3: It is important that students become familiar with online collaborative environments has an average Likert value of 4.4
This shows that most of the respondents believe that being familiar with online environment as well as sharing and publishing academic content in online platforms is important for students.
On the other hand, the statements with the lowest average Likert value are about the Use Behavior (USE). Four of the five questions related to the Use Behavior of Wikipedia have an average Likert value of less than 3.0. About half of the respondents give a rating of 1 or 2 for these four questions about the Use Behavior of Wikipedia.
- USE1: I use Wikipedia to develop my teaching materials has an average Likert value of 2.1
- USE2: I use Wikipedia as a platform to develop educational activities with students has an average Likert value of 1.8
- USE3: I recommend my students to use Wikipedia has an average Likert value of 2.7
- USE4: I recommend my colleagues to use Wikipedia has an average Likert value of 2.6
Other statements which is also a bit related to the use of Wikipedia also have a very low average Likert value.
- EXP4: I contribute to Wikipedia (editions, revisions, articles improvement) has an average Likert value of 1.6
- EXP5: I use wikis to work with my students has an average Likert value of 2.5
This shows that academic usage of Wikipedia is still not very common in the two universities studied.
The factor with the highest average Likert value is Sharing Attitude (4.235), while Use Behavior has the lowest average Likert value (2.494). This shows that even though most of the respondents believe that it is important for students to share academic contents and become familiar with online collaborative environment, they haven't used Wikipedia and do not recommend their students or colleagues to use Wikipedia for educational activities.
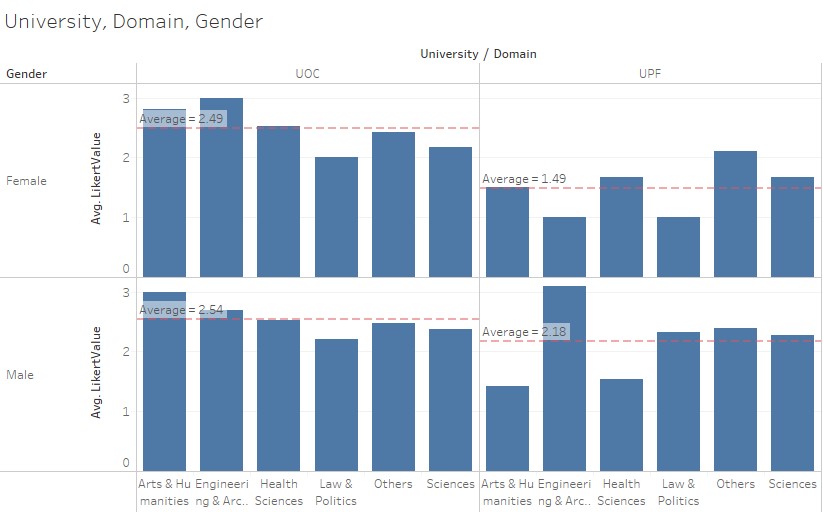
Regarding the use of wiki to work with students, there is a difference in rating given by respondents from UOC and UPF for both male and female respondent, as can be seen from the average Likert value. Both male and female respondents from the various domains from UPF give a lower rating than respondents from UOC regarding the use of wiki to work with students, with the exception of male respondents from Engineering & Architecture and Law & Politics domain.
There is also a difference in the average ratings given about the use of wiki to work with students between male and female respondents of UPF university from the Engineering and Architecture domain. (Male = 3.09, Female = 1.00)
The average rating given by male respondents from the Arts & Humanities domain is also quite different between the two universities. (UOC = 3.00, UPF = 1.43)
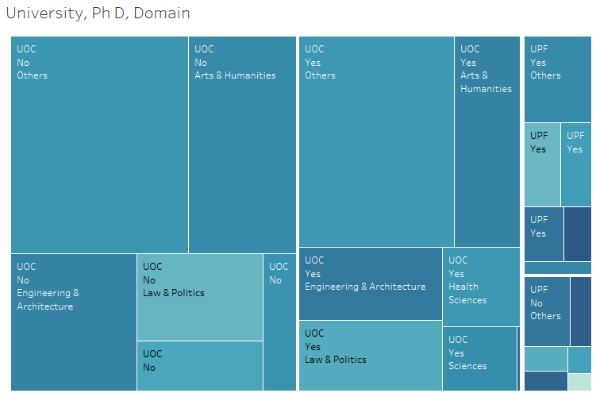
From the treemap above, we can see that non-Ph D and Ph D respondents from the Law & Politics domain of UPF have a different rating on consulting Wikipedia for issues related to their field of expertise. (Non-Ph D = 1.00, Ph D = 3.25) We can also see that the most common domain is the "Others" domain, followed by Arts & Humanities and Engineering & Architecture. The comparison of the number of non-Ph D and Ph D respondent is quite balanced. Lastly, the number of respondents from UOC is much more than UPF.
Interactive Dashboards
There are some interactive dashboards shared on Tableau Public for this assignment. The link to Tableau Public for each dashboard can be accessed below:
Dashboard 1[2]
Dashboard 2[3]
Dashboard 3[4]
Dashboard 4[5]
References
http://www.datarevelations.com/using-tableau-to-visualize-survey-data-part-1.html
http://www.datarevelations.com/using-tableau-to-visualize-survey-data-part-2.html
