Difference between revisions of "ISSS608 2016-17 T1 Assign2 XI QIUYUN"
| Line 16: | Line 16: | ||
At last, combine these table into a table which have the total number of indicators of each company by year. | At last, combine these table into a table which have the total number of indicators of each company by year. | ||
| − | [[File:Data 2.PNG| | + | [[File:Data 2.PNG|700px|thumbnail|center]] |
=====Stack===== | =====Stack===== | ||
Another change is stacking. After sorting important indicators, I stack years to observe time series variable. | Another change is stacking. After sorting important indicators, I stack years to observe time series variable. | ||
[[File:Data 3.png|800*800px|framed|center]] | [[File:Data 3.png|800*800px|framed|center]] | ||
| + | |||
| + | ===Observations in indicators=== | ||
| + | =====Distribution===== | ||
| + | The following two pictures show the distribution of the number of indicators by company in 2010-2016. We can see that except 2010, 2011 and 2016, in other years, the number of indicators of companies are around 100 to 270. | ||
| + | [[File:Distribution 1.PNG|700px|thumbnail|center]] | ||
| + | [[File:Distribution 2.PNG|700px|thumbnail|center]] | ||
| + | |||
| + | I noticed that the maximums are all relatively big. It must have some indicators that most companies have just as the following boxplot shown. So next step is finding those indicators. | ||
| + | |||
| + | [[File:Distribution 3.png|500px|framed|center]] | ||
| + | |||
| + | =====Common Indicators===== | ||
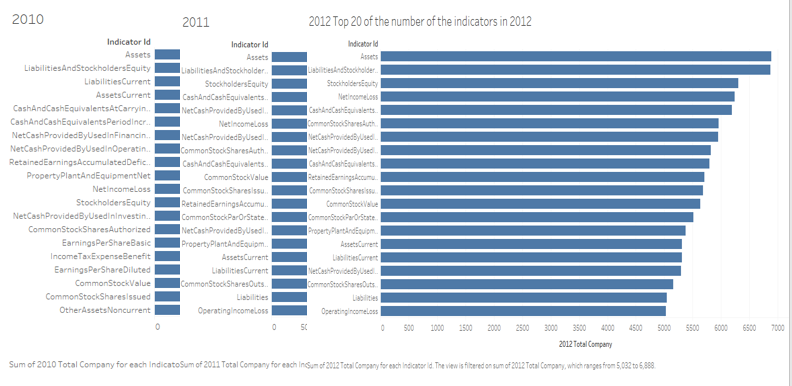
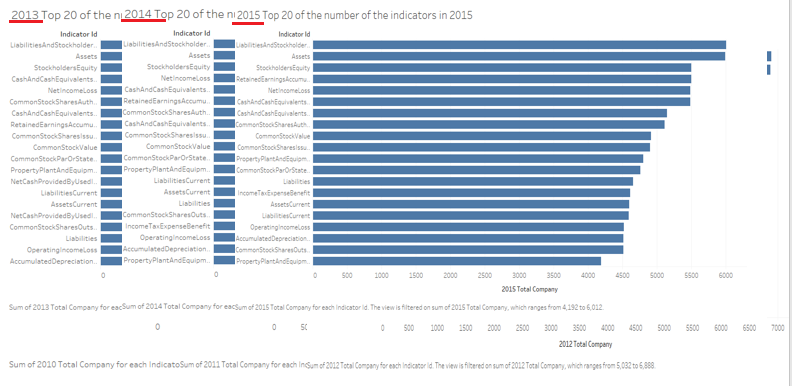
| + | I counted the number of each indicator in 2010 to 2016. Then I sorted top 20 of them. From above pictures, we can see that most of companies all have some same indicators. Maybe I can conclude that those indicators are all common and important to each company. | ||
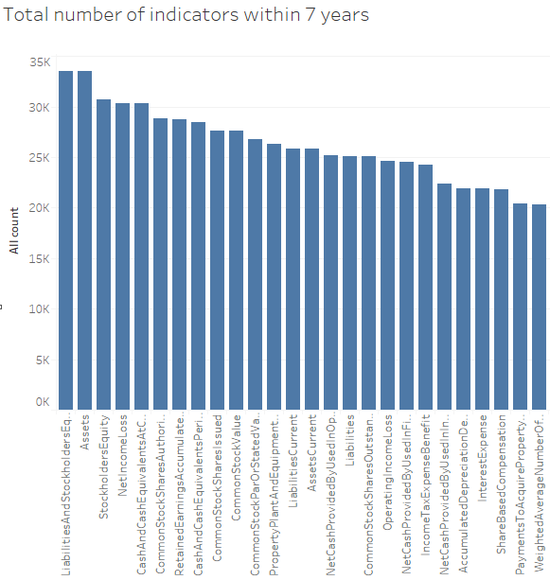
| + | Through comparing and calculating the whole number of indicators within 7 years, I listed the most common indicators and splited them into 9 categories. | ||
| + | There are: | ||
| + | |||
| + | '''ASSETS''': Assets, AssetsCurrent | ||
| + | |||
| + | '''CASH''': Cash and Cash Equivalents at Carrying Value, Cash and cash equivalents Period Increase Decrease | ||
| + | |||
| + | '''LIABILITY''': Liabilities, Liabilities and stockholders Equity, Liabilities Current | ||
| + | |||
| + | '''Net CASH''': Net cash provided by used in operating activities, net cash provided by used in financing activities, net cash provided by used in investing activities | ||
| + | |||
| + | '''STOCK''': Stockholders equity, common stock value, common stock shares authorized, common stock shares issued, common stock shares outstanding, common stock par or stated value per share | ||
| + | |||
| + | '''RETAINED EARNING''': Retained earning accumulated deficit | ||
| + | |||
| + | '''PROPERTY''': Property plant and equipment net | ||
| + | |||
| + | '''INCOME''': Operating income loss, Net income loss | ||
| + | |||
| + | '''TAX''': Income tax expense benefit | ||
| + | |||
| + | [[File:Compare 0.png|500px|framed|center]] | ||
| + | [[File:Compare 1.png|500px|framed|center]] | ||
| + | [[File:Compare 2.png|550px|thumbnail|center]] | ||
Revision as of 20:38, 25 September 2016
Contents
Abstract
We all know that US stock market is one of the biggest markets in the world. In that market, there are many companies, of course, it will have better companies and terrible companies. So we can observe these listed companies from their financial index or fundamental value. Based on these data, analyse these data, find some interesting things and finally we can have some conclusions about US listed companies.
Problem
- What’s the most important or common indicators of a company?
- What’s the correlation between those common indicators?
- How the values of common indicators changed in different years?
- What’s the difference among companies with the same indicators?
- Are there existing some unique companies?
Approaches
Data preparation
Split
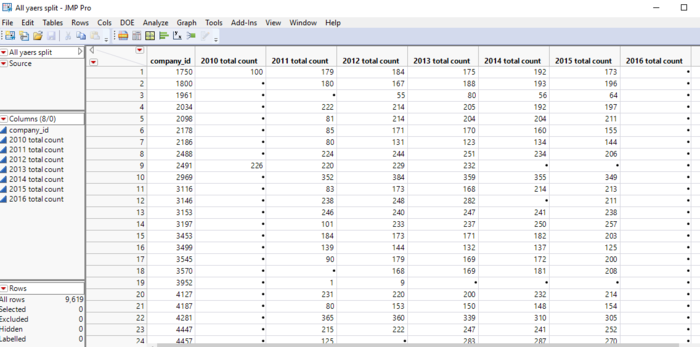
Through splitting the original table, I split “indicators” row to columns by every year. Then calculate the number of indicators of every company in each year.
At last, combine these table into a table which have the total number of indicators of each company by year.
Stack
Another change is stacking. After sorting important indicators, I stack years to observe time series variable.
Observations in indicators
Distribution
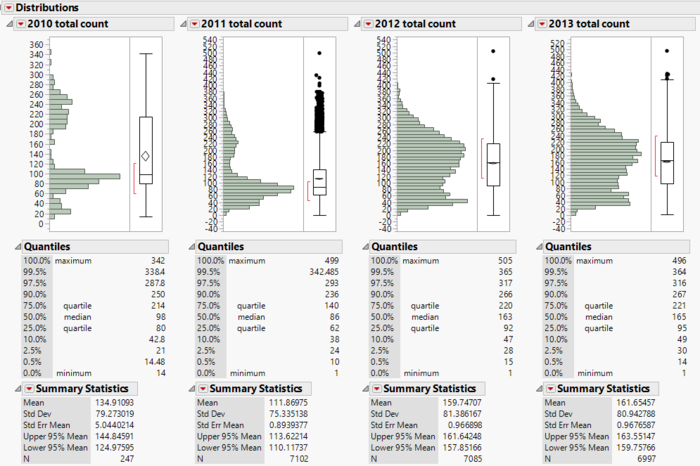
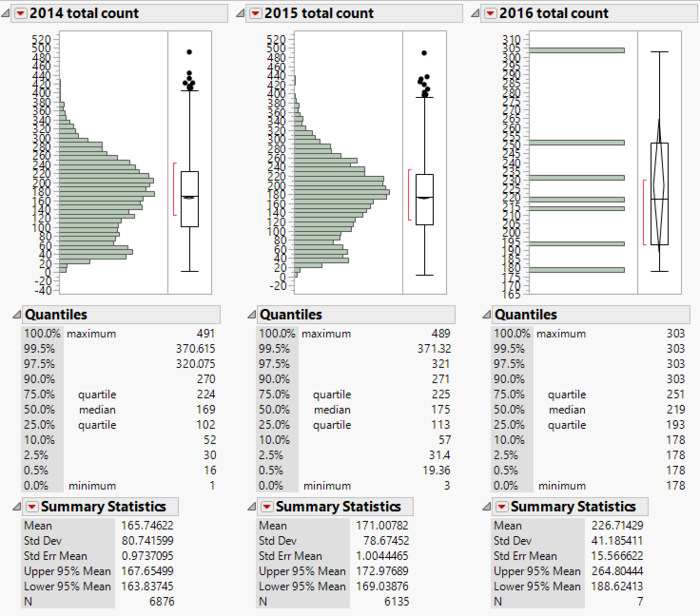
The following two pictures show the distribution of the number of indicators by company in 2010-2016. We can see that except 2010, 2011 and 2016, in other years, the number of indicators of companies are around 100 to 270.
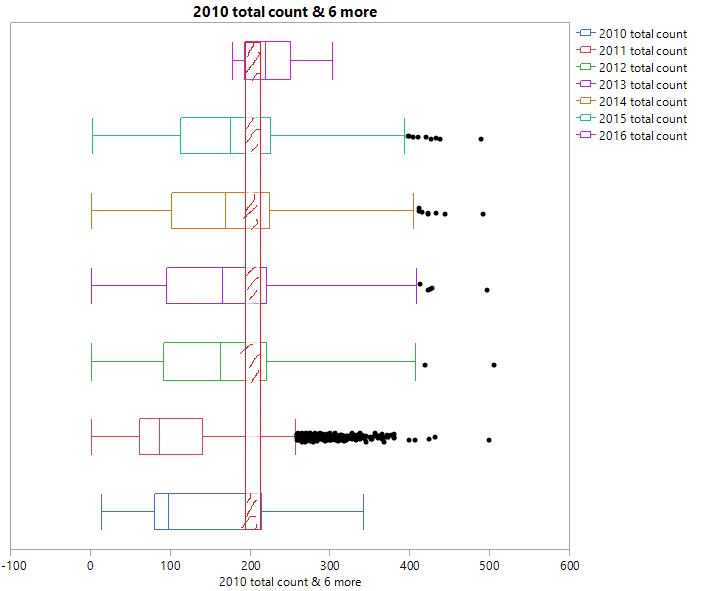
I noticed that the maximums are all relatively big. It must have some indicators that most companies have just as the following boxplot shown. So next step is finding those indicators.
Common Indicators
I counted the number of each indicator in 2010 to 2016. Then I sorted top 20 of them. From above pictures, we can see that most of companies all have some same indicators. Maybe I can conclude that those indicators are all common and important to each company. Through comparing and calculating the whole number of indicators within 7 years, I listed the most common indicators and splited them into 9 categories. There are:
ASSETS: Assets, AssetsCurrent
CASH: Cash and Cash Equivalents at Carrying Value, Cash and cash equivalents Period Increase Decrease
LIABILITY: Liabilities, Liabilities and stockholders Equity, Liabilities Current
Net CASH: Net cash provided by used in operating activities, net cash provided by used in financing activities, net cash provided by used in investing activities
STOCK: Stockholders equity, common stock value, common stock shares authorized, common stock shares issued, common stock shares outstanding, common stock par or stated value per share
RETAINED EARNING: Retained earning accumulated deficit
PROPERTY: Property plant and equipment net
INCOME: Operating income loss, Net income loss
TAX: Income tax expense benefit

