Difference between revisions of "ISSS608 2016 17T1 Group1 Application"
Jump to navigation
Jump to search
| Line 12: | Line 12: | ||
|} | |} | ||
| − | https://github.com/BeiJiaKee/MITB_VisualAnalytics_SGBus | + | =Installation guide= |
| + | No installation is required. | ||
| + | |||
| + | Just download the folders from GitHub (link: https://github.com/BeiJiaKee/MITB_VisualAnalytics_SGBus) and unzip bower-components.zip. | ||
| + | |||
| + | Now you are ready to run! | ||
| + | [[File: github.jpg |500px|thumb|center| ScreenShot of GitHub ]] | ||
| + | =User Guide= | ||
| + | you may use any local web host you wish to. | ||
| + | |||
| + | Steps: | ||
| + | # Start up your local host (e.g. easy php) | ||
| + | # Navigate to the project folders to "MITB_VisualAnalytics_SGBus/demos/SG-Bus.html" | ||
| + | # Run SG-Bus.html | ||
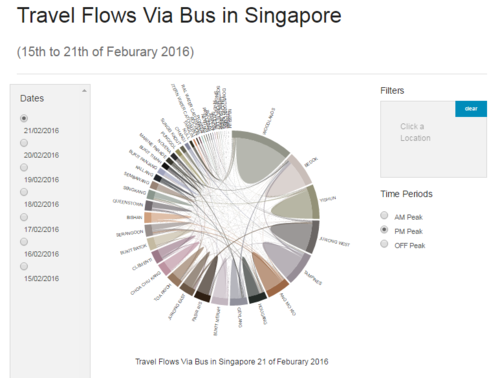
| + | # On the dashboard produced, User may switch between dates and peak periods to explore the data | ||
| + | [[File: dashboard_VA.PNG |500px|thumb|center|ScreenShot of dashboard| ]] | ||
Revision as of 23:23, 27 November 2016
| PROPOSAL | POSTER | APPLICATION | REPORT |
Installation guide
No installation is required.
Just download the folders from GitHub (link: https://github.com/BeiJiaKee/MITB_VisualAnalytics_SGBus) and unzip bower-components.zip.
Now you are ready to run!
User Guide
you may use any local web host you wish to.
Steps:
- Start up your local host (e.g. easy php)
- Navigate to the project folders to "MITB_VisualAnalytics_SGBus/demos/SG-Bus.html"
- Run SG-Bus.html
- On the dashboard produced, User may switch between dates and peak periods to explore the data

