Difference between revisions of "ISSS608 2016 17T1 Group1 Report"
Jump to navigation
Jump to search
(Created page with "{|style="background-color:#000066; color:#000066 padding: 5px 0 0 0;" width="100%" cellspacing="0" cellpadding="0" valign="top" border="0" | | style="padding:0.4em; font-size...") |
|||
| Line 11: | Line 11: | ||
| style="padding:0.4em; font-size:90%; background-color:#000066; border-bottom:4px solid #000066; border-top:4px solid #000066; text-align:center; color:#000066" width="10%" |[[ISSS608_2016_17T1_Group1_Report|<font color="#ffffff" size=2><b>REPORT</b></font>]] | | style="padding:0.4em; font-size:90%; background-color:#000066; border-bottom:4px solid #000066; border-top:4px solid #000066; text-align:center; color:#000066" width="10%" |[[ISSS608_2016_17T1_Group1_Report|<font color="#ffffff" size=2><b>REPORT</b></font>]] | ||
|} | |} | ||
| + | |||
| + | |||
| + | |||
| + | =Motivation of the Application= | ||
| + | |||
| + | An Ezlink passenger travel record over 7 days has 500 millions + rows of data and 50+ variables. The raw data was too large for visualisation tools such as Tableau and D3.JS to read and process. Even loading the data into JMP proved to be a challenge and on average it took at least 30 mins to read in the csv data and convert into JMP format. Hence the ability to visualise the raw data was very limited. | ||
| + | |||
| + | The objective of the project was to prepare and manipulate the raw data into manageable data size for analysis on visualisation tools such as Tableau and D3.JS. | ||
| + | |||
| + | |||
| + | =Review and Critic of Past Works= | ||
| + | |||
| + | ==Data Exploration== | ||
| + | |||
| + | |||
| + | |||
| + | ==Sparklines in R== | ||
| + | |||
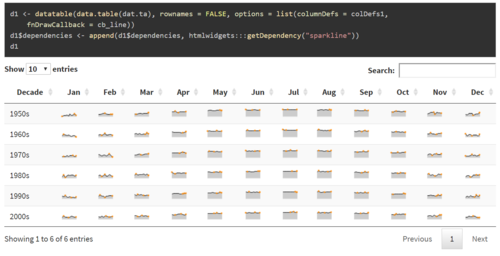
| + | [[File: Combining data tables and sparklines.PNG|500px|thumb|center| Matthew Leonawicz (2010) Combining data tables and sparklines]] | ||
| + | |||
| + | |||
| + | == Chords Diagram in R== | ||
| + | |||
| + | |||
| + | [[File: Visualize Relations by Chord Diagram in R.PNG|500px|thumb|center| Zuguang Gu (2016) Visualize Relations by Chord Diagram]] | ||
| + | |||
| + | |||
| + | ==Chords Diagram in D3.JS== | ||
| + | |||
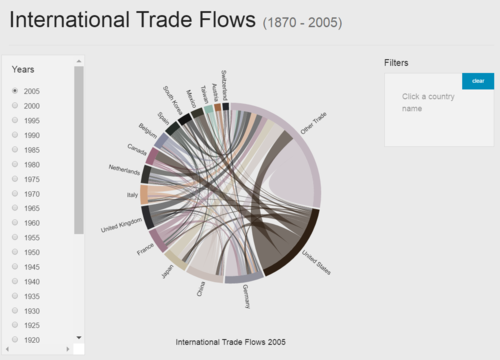
| + | [[File: Interactive Chords Trade Data.PNG|500px|thumb|center|Steven Hall (2014) Interactive Chord Diagrams in D3]] | ||
| + | |||
| + | |||
| + | =Design Framework= | ||
| + | |||
| + | |||
| + | ==Selection of Tools== | ||
| + | |||
| + | |||
| + | =Demonstration= | ||
| + | |||
| + | |||
| + | =Discussion= | ||
| + | |||
| + | |||
| + | =Future Work= | ||
| + | |||
| + | [[File: BEERVIZ.PNG|500px|thumb|center| Divya, Evie, Shreyas, Sonali (2013) BEERVIZ, Discover beers, & say cheers!]] | ||
| + | |||
| + | |||
| + | =Installation guide= | ||
| + | No installation is required. | ||
| + | |||
| + | |||
| + | =User Guide= | ||
| + | |||
| + | |||
| + | |||
| + | =References= | ||
| + | |||
| + | * Matthew Leonawicz (2010). Combining data tables and sparklines. URL: http://leonawicz.github.io/HtmlWidgetExamples/ex_dt_sparkline.html | ||
| + | |||
| + | * Steven Hall (2014). Interactive Chord Diagrams in D3. URL: http://www.delimited.io/blog/2014/11/18/interactive-chord-diagrams-in-d3 | ||
| + | |||
| + | * Zuguang Gu (2016). Visualize Relations by Chord Diagram. URL: https://cran.r-project.org/web/packages/circlize/vignettes/visualize_relations_by_chord_diagram.pdf | ||
Revision as of 03:29, 27 November 2016
| PROPOSAL | POSTER | APPLICATION | REPORT |
Contents
Motivation of the Application
An Ezlink passenger travel record over 7 days has 500 millions + rows of data and 50+ variables. The raw data was too large for visualisation tools such as Tableau and D3.JS to read and process. Even loading the data into JMP proved to be a challenge and on average it took at least 30 mins to read in the csv data and convert into JMP format. Hence the ability to visualise the raw data was very limited.
The objective of the project was to prepare and manipulate the raw data into manageable data size for analysis on visualisation tools such as Tableau and D3.JS.
Review and Critic of Past Works
Data Exploration
Sparklines in R
Chords Diagram in R
Chords Diagram in D3.JS
Design Framework
Selection of Tools
Demonstration
Discussion
Future Work
Installation guide
No installation is required.
User Guide
References
- Matthew Leonawicz (2010). Combining data tables and sparklines. URL: http://leonawicz.github.io/HtmlWidgetExamples/ex_dt_sparkline.html
- Steven Hall (2014). Interactive Chord Diagrams in D3. URL: http://www.delimited.io/blog/2014/11/18/interactive-chord-diagrams-in-d3
- Zuguang Gu (2016). Visualize Relations by Chord Diagram. URL: https://cran.r-project.org/web/packages/circlize/vignettes/visualize_relations_by_chord_diagram.pdf


