Difference between revisions of "ISSS608 2016-17 T1 Assign1 XI QIUYUN"
| Line 22: | Line 22: | ||
=Approaches= | =Approaches= | ||
| + | |||
| + | ===Money First=== | ||
| + | '''Price''' | ||
| + | |||
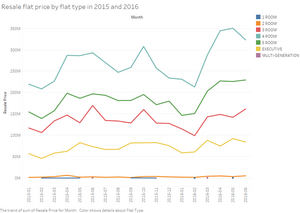
| + | Since money is a thing that people always first concerned about. Thus, I wanted to analysed resale public house price by flat type in 2015 and 2016. I chose a line graph because it can show a price trend more clear than a bar chart. Secondly, I used flat type to be one of variables in order to exclude the possible that different types result in another tendency. | ||
| + | |||
| + | [[File:Resale flat price by flat type in 2015 and 2016.png|750*500px|frameless]] | ||
=Results= | =Results= | ||
<br/> | <br/> | ||
Revision as of 23:08, 28 August 2016
Abstract
Problem and Motivation
We all know that if you want to buy a flat, you must consider many related matters such as surroundings, transportation and location. But I believe that the most important thing people concerned is the price.
• So what the distribution of resale public housing prices in 2015?
• What the shares of resale public housing supply in 2015?
• What the differences between 2015 and 2016?
When I first came to Singapore, I was truly curious about the policy of HDB. It is so novel to me as a foreigner. I can’t stop thinking that if I’m a Singaporean, how do I choose my own flat? So I’m very glad to analyse Singapore’s public housing policy and make some conclusions through their price and supply.
Approaches
Money First
Price
Since money is a thing that people always first concerned about. Thus, I wanted to analysed resale public house price by flat type in 2015 and 2016. I chose a line graph because it can show a price trend more clear than a bar chart. Secondly, I used flat type to be one of variables in order to exclude the possible that different types result in another tendency.
Results
