ISSS608 2016-17 T1 Assign1 XI QIUYUN
Contents
Abstract
Singapore has a very special policy about property which is public housing.We all know that there are three ways buying a flat. But if you want to buy a resale house, you must consider many related matters such as surroundings, transportation and location. I believe that the most important thing people concerned is the price.
- So how the price change in one year by different aspects?
- What the best time I buy a flat?
- Where location should I choose in the end?
Problem and Motivation
In this project, we analyzed resale public housing data to figure out the following problems. Meanwhile, giving some advice about how to choose an appropriate flat.
- What the distribution of resale public housing prices in 2015?
- What the shares of resale public housing supply in 2015?
- What the differences between 2015 and 2016?
When I first came to Singapore, I was truly curious about the policy of HDB. It is so novel to me as a foreigner. I can’t stop thinking that if I’m a Singaporean, how do I choose my own flat? So I’m very glad to analyse Singapore’s public housing policy and make some conclusions through their price and supply.
Approaches
Money First
Price
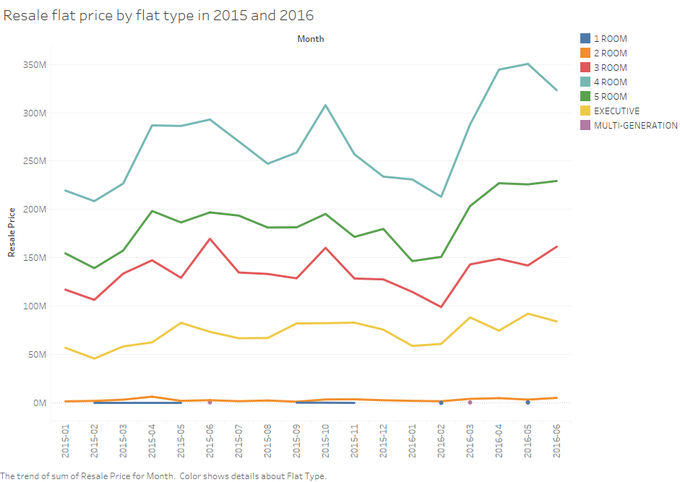
Since money is a thing that people always first concerned about. Thus, I wanted to analysed resale public house price by flat type in 2015 and 2016. I chose a line graph because it can show a price trend more clear than a bar chart. Secondly, I used flat type to be one of variables in order to exclude the possible that different types result in another tendency.
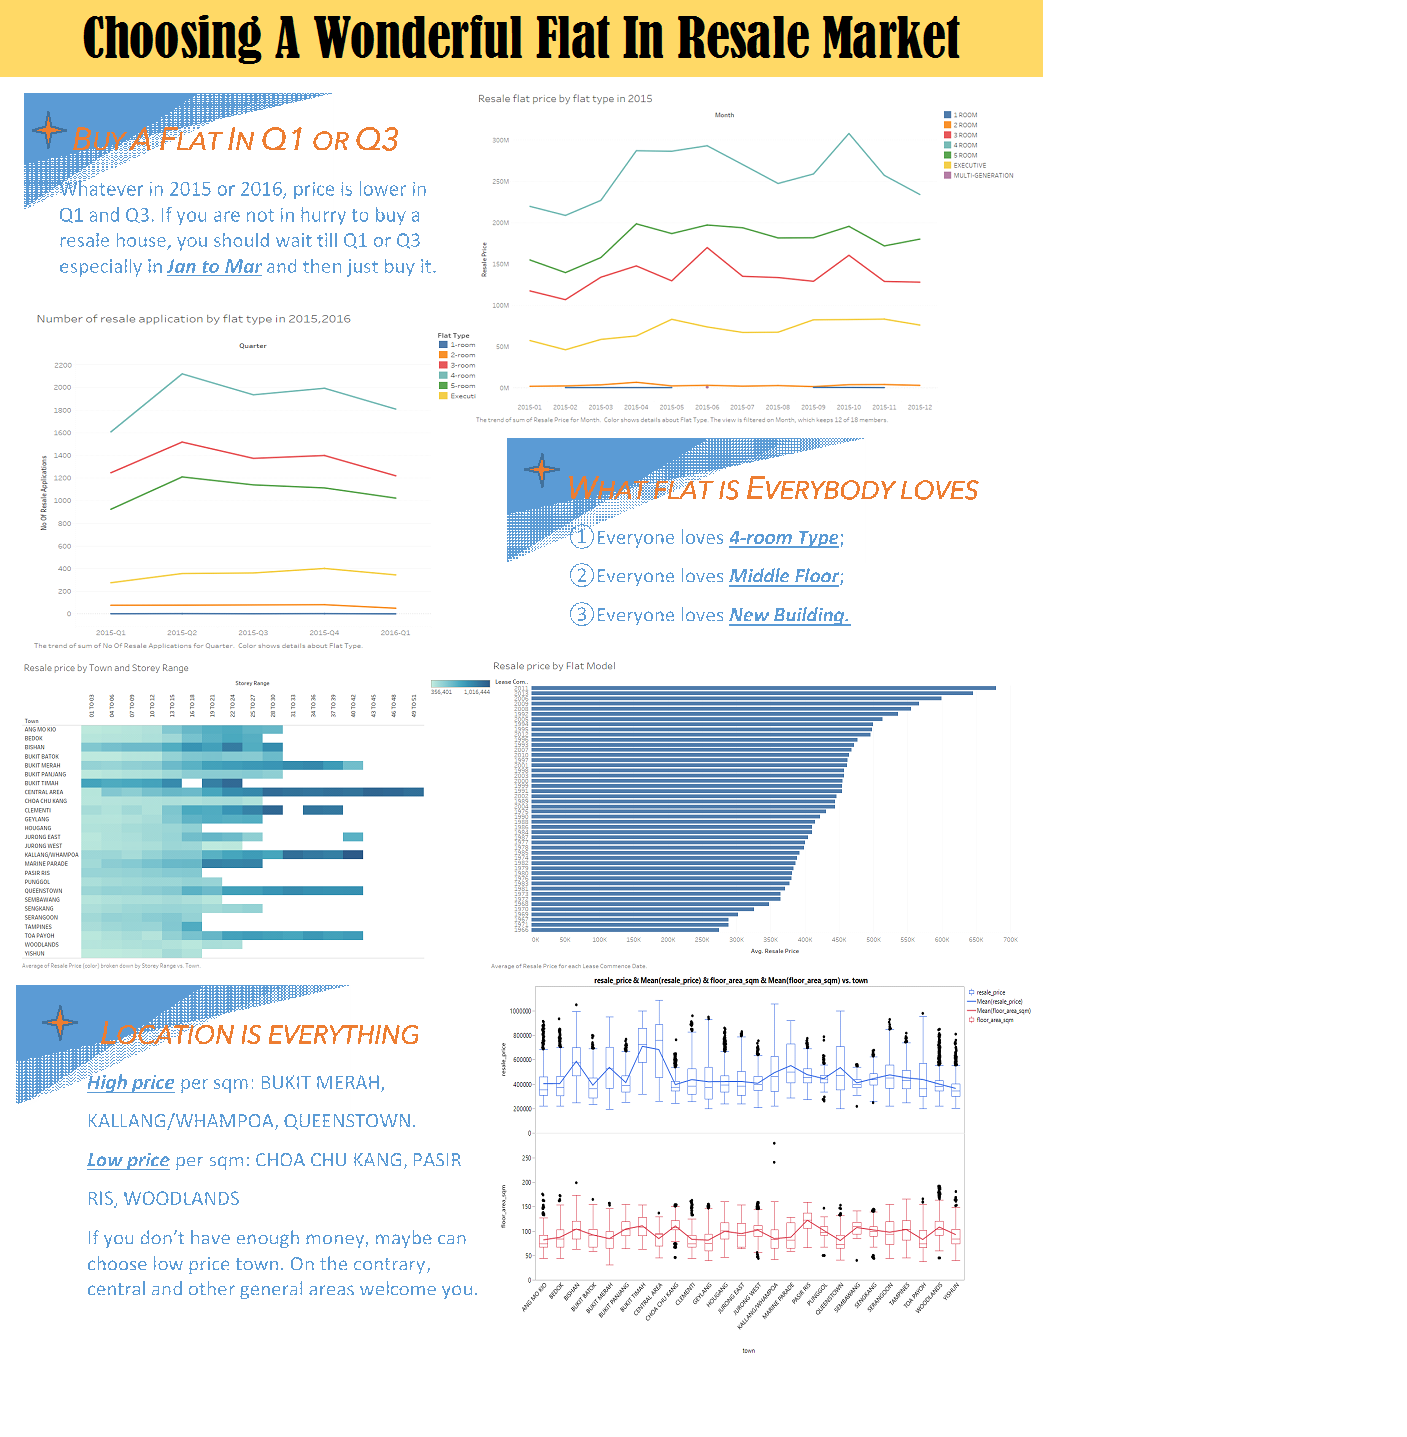
From the above graph, I notice a clear trend in a year and it is the same trend in 2015 to first- half 2016. Flat price reaches the lowest point whatever type in quarter 1 and quarter 4. Obviously, in Q2 and Q3, it is the time that you will buy the most expensive house. But 2016 Q1 and Q2 had higher price than 2015 Q1 and Q2. Another find is that the 4-room flats always have the highest price, the next is the 3-room flat and 5-room flat.
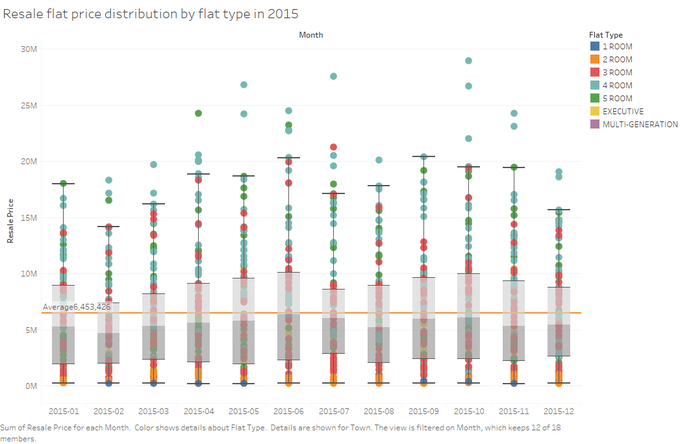
On the basis of last graph, I added the fourth variable—town, used boxplot and added average line. Every point represents a flat in a specific town with a specific price and month. The boxplot shows that 3-5 rooms flats’ price clearly higher the average level. What’s more, 4-room flat obviously more expensive than several other types flat whatever location.
Demand
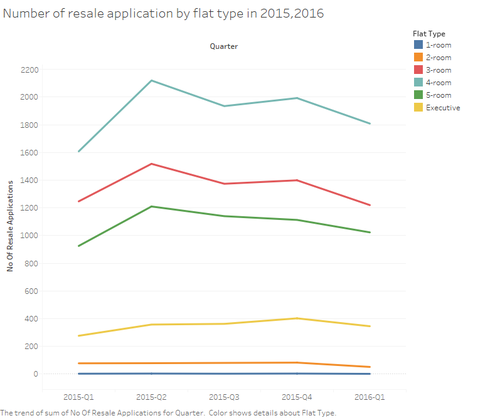
As long as there is a demand would have a market. Customers demand influence the change of price to some extent. You will feel familiar when you see the following line graph. The line trend almost is same to the price line both in 2015 and 2016. Customers’ demand does affect the price changes. So maybe we can predict house prices based on the demand.
Floor
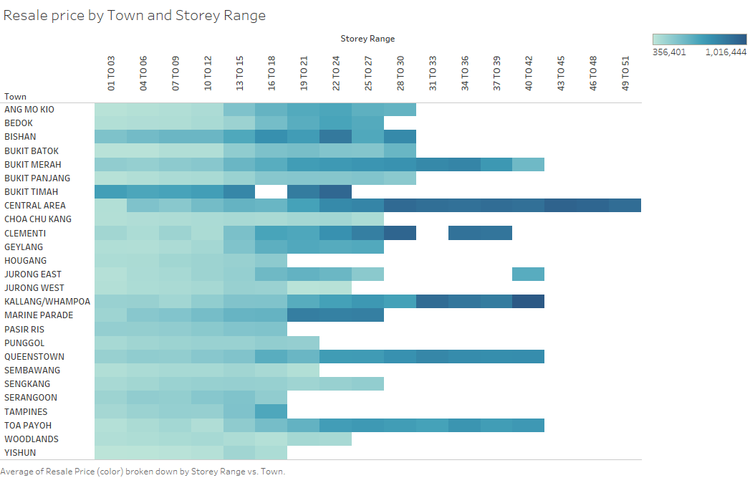
Of course people will concern the floor when they buy a flat. The storey decides landscape. Usually, in my experience, the middle floor flat has higher price than other floor. The following graph verify my opinion.
Year
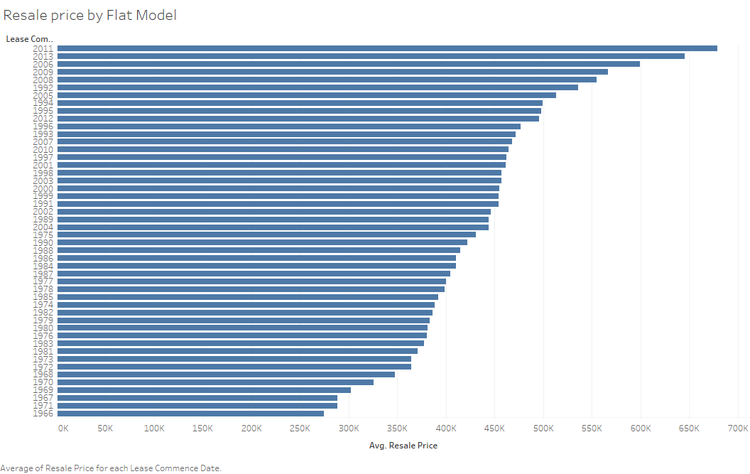
Maybe most people believe that the house newer more expensive. Surprisely, however, the most expensive flat was built in 2011, followed is 2013 and 2006.
Location Next
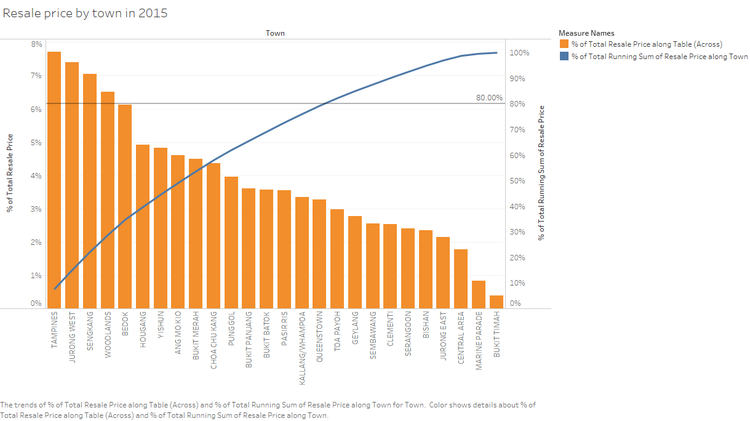
I used town and price variable to draw a Pareto chart. We can see that the distribution doesn’t follow ‘80%/20% rule’. There are just 11 towns below the 80% line while the total number of towns is 26.
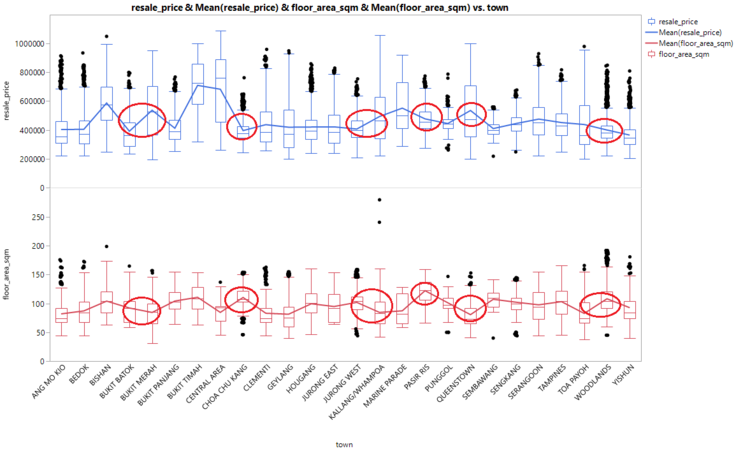
Some strange things must happen in these town. Generally speaking, bigger flat have higher price. But according the following graph, the distribution of price is not perfect correspond with floor area. These points in the graph are BUKIT MERAH, CHOA CHU KANG, KALLANG/WHAMPOA, PASIR RIS, QUEENSTOWN, WOODLANDS. Those locations some have great surroundings or convenience transport some are located in a remote area. For example, KALLANG is close to city square and Marina Bay while PASIR RIS is truly far away from the centre. We have to accept the fact that location is a very important reason for changes of price.
Type Last
Number
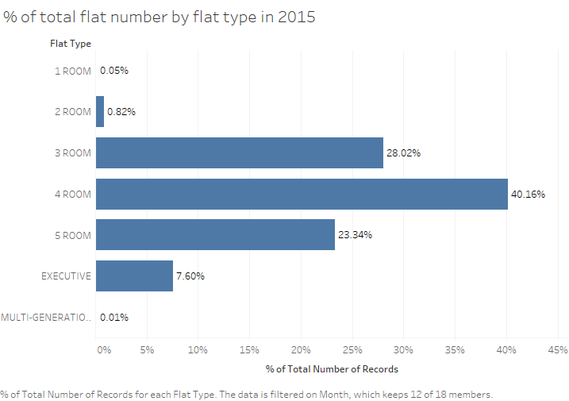
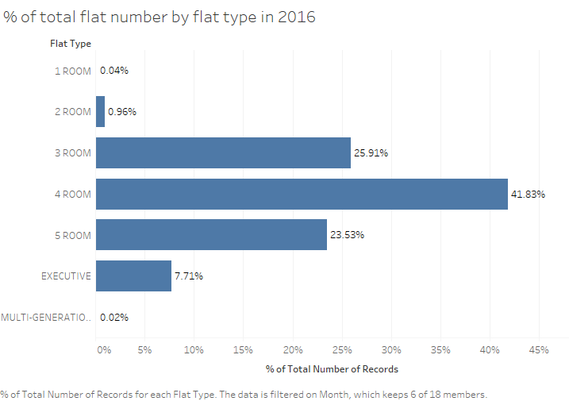
The largest number of flat is 4-room flat, followed by 3-room and 5-room flat. These flats mentioned previous account for over 90% of total flats both in 2015 and first-half 2016. 4-room flat is the hottest type so that the price is the highest. Maybe I can guess that 4-room flat is the most suitable type for Singaporean.
Distribution
Distribution I focused on the 3-room, 4-room, and 5-room flat’s price. The graph 4-room has the smallest Standard Deviation, followed by 3-room flat and 5-room flat. From the following summary statistics, we can know that 4-room flat’s prices are more focused.
Tools Utilised
Tableau 10
Built graph with different variables in different colors.
JMP Pro 12
Analyze variable's distribution.
Excel
Select appropriate data.
Results
According to the above analysis, conclusions are as followed:
- The overall tendency of price is similar in 2015 and 2016. But in 2016, the average price will increase.
- Prices are lower in Q1 and Q3 than other two quarters.
- Demand and supply of 4-room flat is biggest, the price of 4-room flat relatively is the highest, followed by 3-room and 5-room flat.
- In the general area, the 20th to 30th floor flat is most expensive. While in the central area, the most expensive floor is 31st to 50th.
- Houses built in the 20th and 21st centuries is more popular and expensive.
- Location play a great important role in influencing price.
