Difference between revisions of "ISSS608 2016 17T1 Group2 Application"
Jump to navigation
Jump to search
| Line 39: | Line 39: | ||
==Shiny Dashboard of Cancer == | ==Shiny Dashboard of Cancer == | ||
| − | The Shiny dashboard is based on the web server, you can simply click the link to explore. | + | '''The Shiny dashboard is based on the web server, you can simply click the link to explore. |
[https://lidan35.shinyapps.io/ShinyDashboard/ Dashboard1] | [https://lidan35.shinyapps.io/ShinyDashboard/ Dashboard1] | ||
===Shiny Demo=== | ===Shiny Demo=== | ||
Revision as of 22:58, 27 November 2016
|
|
|
|
|
Contents
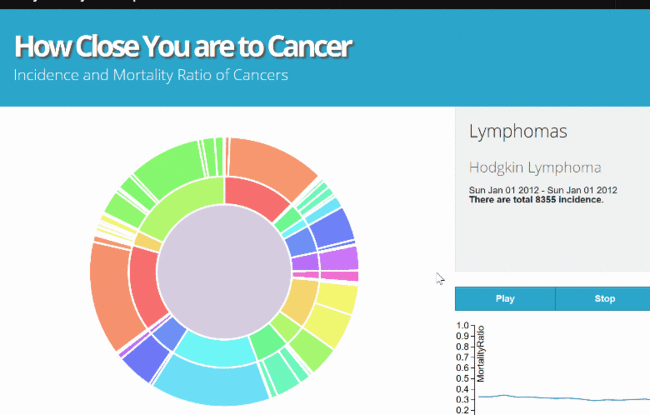
Sunburst of cancer incidencs & mortality
Installation Guide
Please follow the following two steps to explore the sunburst:
1. Download the zip file from the link. Sunburst package
2. After unzipping the package, launch the ‘cancerSub.html’ using Mozilla Firefox.
Sunburst Demo
Shiny Dashboard of Cancer
The Shiny dashboard is based on the web server, you can simply click the link to explore. Dashboard1
Shiny Demo
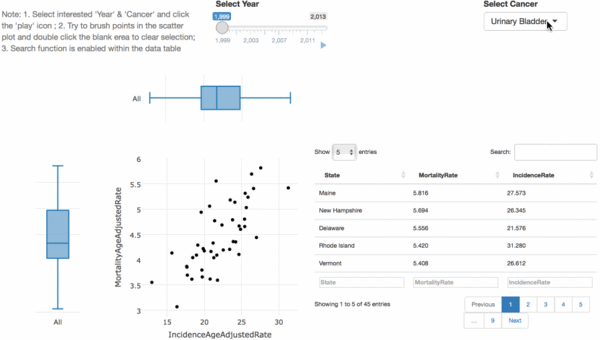
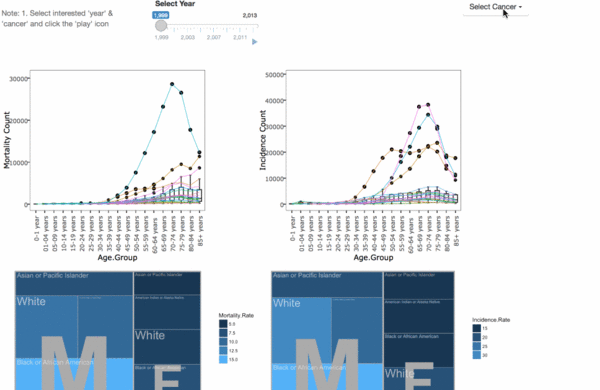
There are two tab in the Shiny dashboard, including 'Cancer by States' and 'Cancer by Demographics'.
- 1. Demo of 'Cancer by States'
- 2. Demo of 'Cancer by Demographics'


