Difference between revisions of "ISSS608 2016-17 T1 Assign2 XU Qiuhui"
Jump to navigation
Jump to search
| Line 58: | Line 58: | ||
=Analysis= | =Analysis= | ||
| + | |||
| + | ==Segmentations== | ||
| + | |||
| + | ==User impressions and behaviors== | ||
| + | |||
| + | ==Relationships beneath the surface== | ||
=Tools Utilized= | =Tools Utilized= | ||
Revision as of 12:19, 26 September 2016
Contents
Data Sources
Dataset from UCI, Survey of faculty members from two Spanish universities on teaching uses of Wikipedia
Source: E. Aibar, J. Lladós, A. Meseguer, J. Minguillón (jminguillona[at]uoc[dot]edu), M. Lerga. Universitat Oberta de Catalunya, Barcelona, Spain.
Theme of Interest and Motivation
This Analysis aims to find out overall impressions of different user segments on Wikipedia and their use behavior according to high dimensional survey question answers. Then propose recommendations for Wikipedia's future development. In this analysis, we'll mainly answer the following questions:
- Segmentations of Wiki users.
- Different impressions and use behaviors of different segments.
- Relationships among user impressions, user behaviors, and external environments.
Data Preparation
Transfer Data Type
| Variables | Original Data Type | Transferred Data Type | Reason |
|---|---|---|---|
| Gender | Numeric | Categorical | According to dataset dictionary, gender is meaningless while using numeric value to do analysis. |
| PhD | Numeric | Categorical | According to dataset dictionary, PhD is meaningless while using numeric value to do analysis. |
| University | Numeric | Categorical | According to dataset dictionary, University is meaningless while using numeric value to do analysis. |
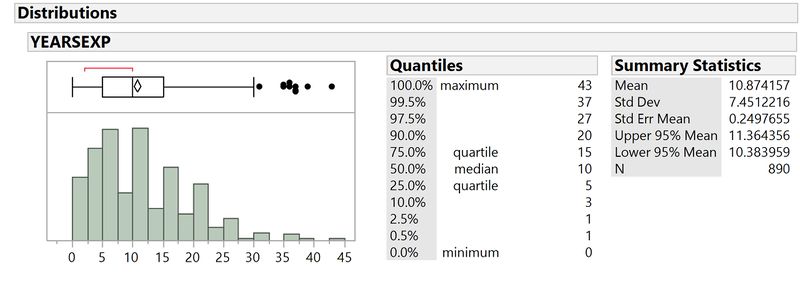
| YearsExp | Categorical | Numeric | Years of experience should be continuous data, so that we can firstly bin them into several groups, then use groups to classify them. |
Bin Numeric Data
| Variables | Original | Transferred Variables | Formula |
|---|---|---|---|
| Age | Age(bin) | If(:AGE <= 30,"20~30",If(:AGE <= 40,"30~40",If(:AGE <= 50,"40~50",If(:AGE <= 60,"50~60","60~70")))) | |
| YearsExp | YearsExp(bin) | If( :YEARSEXP <= 10,"0~10",If( :YEARSEXP <= 20,"10~20",If( :YEARSEXP <= 30,"20~30","more than 30"))) |
Group Categorical Data
Transform all survey question answers with 1-5 scores to “High, Mid, Low” degree.
| Scores | Degree |
|---|---|
| 1 | Low |
| 2 | Low |
| 3 | Mid |
| 4 | High |
| 5 | High |
Visualization
Analysis
Segmentations
User impressions and behaviors
Relationships beneath the surface
Tools Utilized
- High-D - For initial data exploration and analysis
- JMP 12, MS Excel – For data preparation
- d3.js - For data visualization

