ISSS608 2016-17 T1 Assign2 XU Qiuhui
Contents
Data Sources
Dataset from UCI, Survey of faculty members from two Spanish universities on teaching uses of Wikipedia
Source: E. Aibar, J. Lladós, A. Meseguer, J. Minguillón (jminguillona[at]uoc[dot]edu), M. Lerga. Universitat Oberta de Catalunya, Barcelona, Spain.
Theme of Interest and Motivation
This Analysis aims to find out overall impressions of different user segments on Wikipedia and their use behavior according to high dimensional survey question answers. After analysis we'll mainly answer the following questions:
- In this survey, what's the overall estimation people make on Wikipedia
- What's the relationships between user impressions and user behaviors.
- What's the relationships between user behaviors and external environments.
Data Preparation
Transfer Data Type
| Variables | Original Data Type | Transferred Data Type | Reason |
|---|---|---|---|
| Gender | Numeric | Categorical | According to dataset dictionary, gender is meaningless while using numeric value to do analysis. |
| PhD | Numeric | Categorical | According to dataset dictionary, PhD is meaningless while using numeric value to do analysis. |
| University | Numeric | Categorical | According to dataset dictionary, University is meaningless while using numeric value to do analysis. |
| YearsExp | Categorical | Numeric | Years of experience should be continuous data, so that we can firstly bin them into several groups, then use groups to classify them. |
Bin Numeric Data
| Variables | Original | Transferred Variables | Formula |
|---|---|---|---|
| Age | Age(bin) | If(:AGE <= 30,"20~30",If(:AGE <= 40,"30~40",If(:AGE <= 50,"40~50",If(:AGE <= 60,"50~60","60~70")))) | |
| YearsExp | YearsExp(bin) | If( :YEARSEXP <= 10,"0~10",If( :YEARSEXP <= 20,"10~20",If( :YEARSEXP <= 30,"20~30","more than 30"))) |
Group Categorical Data
Transform all survey question answers with 1-5 scores to “High, Mid, Low” degree.
| Scores | Degree |
|---|---|
| 1 | Low |
| 2 | Low |
| 3 | Mid |
| 4 | High |
| 5 | High |
Inset New Column
Insert a new column, User ID to uniquely represent one user in the dataset.
| Variable | Data Type | Example | Description |
|---|---|---|---|
| UserID | Categorical | “U1”, “U2” …” U913” | Each User ID uniquely identifies a user in the dataset. |
Visualization
Tableau Interactive Charts:
Analysis
User Profile
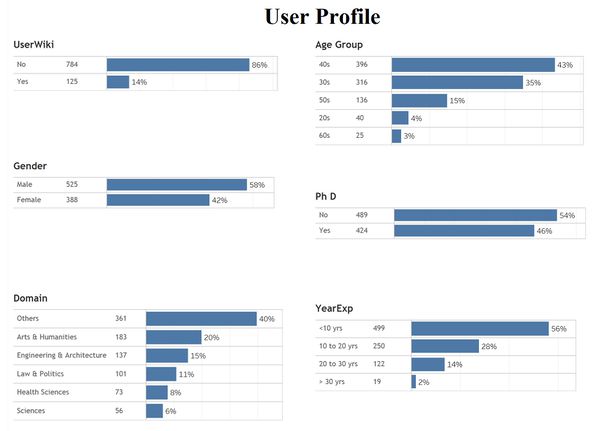
- Among people who respond to the survey, number of people with and without PhD degree are comparable, while those who don't hold a PhD degree are relatively higher.
- As years of experience increase, number of respondents decrease.
- Almost half of respondents come from unknown domain, others mainly come from arts & humanities, engineering and law.
- Among all respondents, number of Adjunct are dominant.
User Perceptions of Wiki in Different Segments
Initial Version
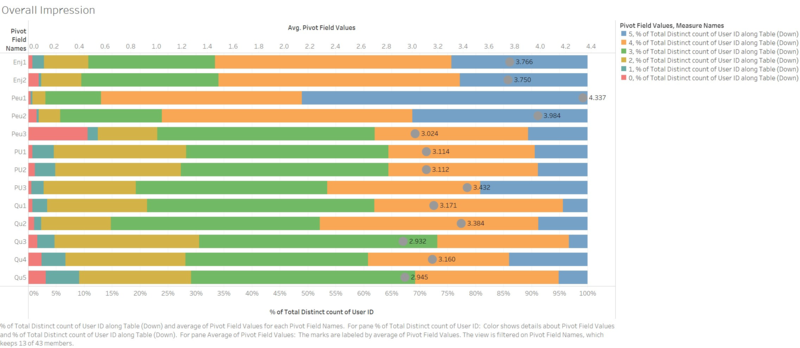
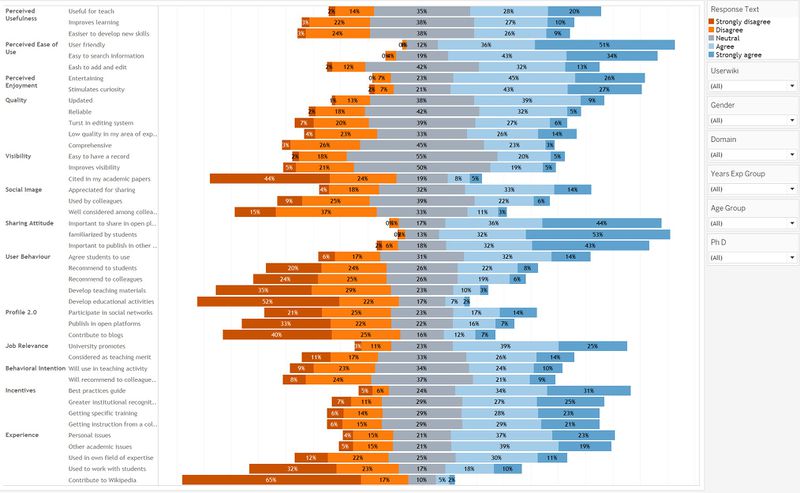
We selected 4 dimensions, usefulness, ease of use, enjoyment, and quality, to see score distribution and average score to get to know people's overall impression on Wikipedia. As we can see, generally, average scores are higher than 3, which is median value. So we consider, overall, people has a positive impression on Wiki. Then we Drill down to each detailed dimension. For quality, it's the lowest on average, and also has fewer responds as score increases. So among usefulness, quality, ease of use, and enjoyment, we consider quality is Wikipedia's weakest feature. For perceived ease of use, responders gave the highest rates.
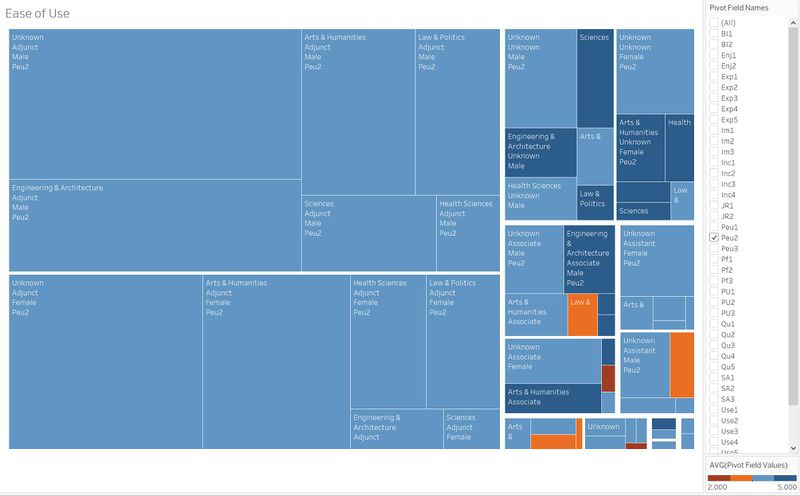
According to the barchart above, we find PEU2 got the highest average score as well as the highest number of score 5. So here we use treemap to generate user segments to find out which segments are most satisfied with Wikipedia. In the treemap, we use three dimensions, domain, UOC position and gender to draft segments and use average score to differentiate coloring. Those little square with orange and burgundy colors are most unsatisfied segments, they are in Health Science and Law & Politics domain. Similarly, we can use filter to select any question(s) we interested in to find out different satisfaction rate in different segments.
Revised Version
- Overall, respondents have positive perception on ease of use, enjoyment and sharing attitude.
- For visibility, user behavior, profile 2.0 and experiences attributes are perceived negative by respondents.
- In Dashboard, by selecting different filters we can get respondents' perception in different segments.
Relationships
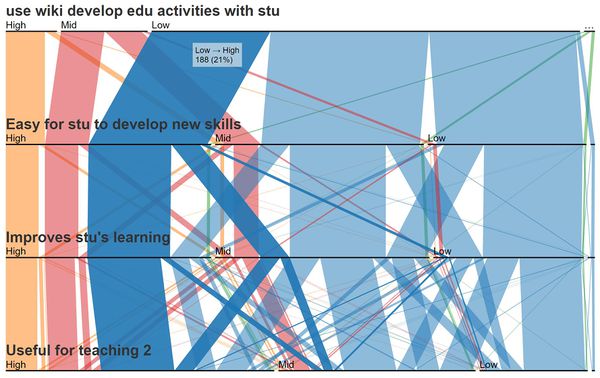
There’s a large proportion of UOC faculties who don’t use Wikipedia to teach but have a very good impression on Wiki, we consider they’re the most potential users.
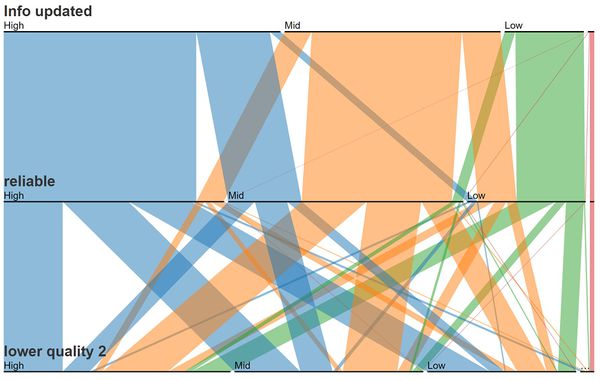
Information on Wikipedia are considered updated and relatively reliable, but still considered with lower quality than other educational resources.
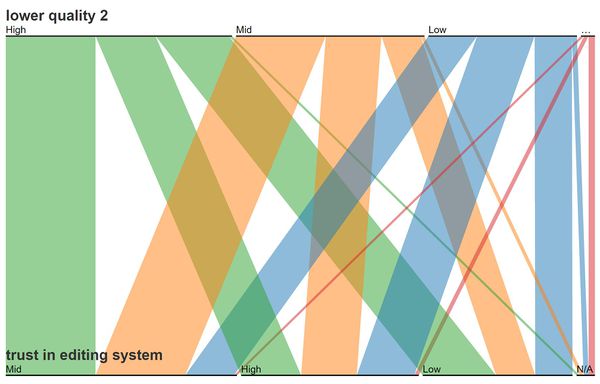
Even though wiki is considered with lower quality, users still trust in its editing system.
User behaviors and external environments
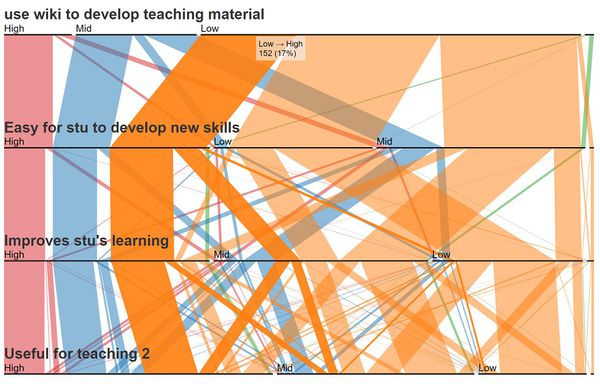
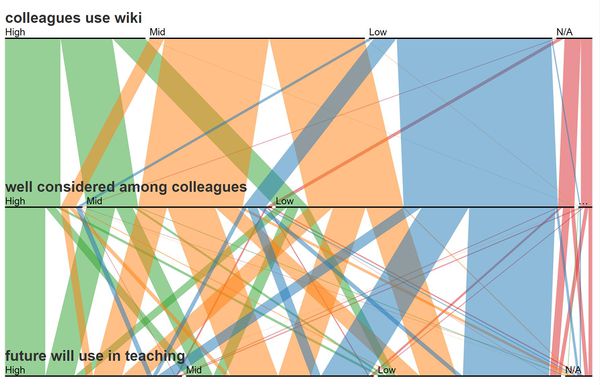
External environments tend to have huge influences on behavioral intention. Form the parallel set we can clearly get that almost all people whose colleagues don’t use wiki and are not consider well on wiki are not intended to use wiki in teaching in the future.
Key Findings
- Overall, people have a positive impression on Wiki. Quality is Wikipedia's weakest feature.
- There’s a large proportion of UOC faculties who don’t use Wikipedia to teach but have a very good impression on Wiki, we consider they’re the most potential users.
- Information on Wikipedia are considered updated and relatively reliable, but still considered with lower quality than other educational resources.
- Even though wiki is considered with lower quality than other educational resources, users still trust in its editing system.
- External environments, especial colleagues’ comments and behavior, tend to have huge influences on behavioral intention.
Tools Utilized
- High-D - For initial data exploration and analysis
- JMP 12, MS Excel – For data preparation
- d3.js, Tableau, Treemap - For data visualization
