Difference between revisions of "ISSS608 2016-17 T1 Assign2 Frandy Eddy"
Jump to navigation
Jump to search
| Line 34: | Line 34: | ||
Link to Tableau Public : | Link to Tableau Public : | ||
| + | <br /> | ||
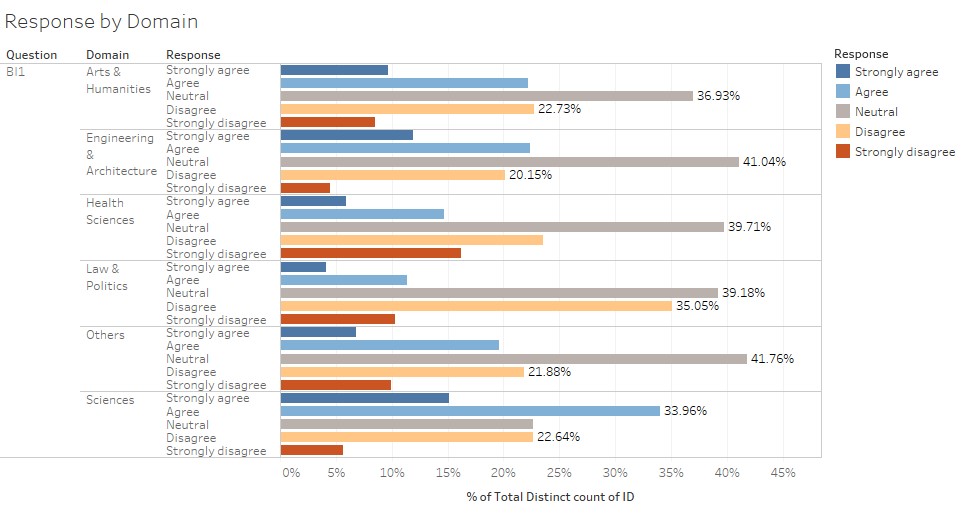
Dashboard 1[https://public.tableau.com/profile/frandy.eddy#!/vizhome/ResponsebyDomain_0/ResponsebyDomain] | Dashboard 1[https://public.tableau.com/profile/frandy.eddy#!/vizhome/ResponsebyDomain_0/ResponsebyDomain] | ||
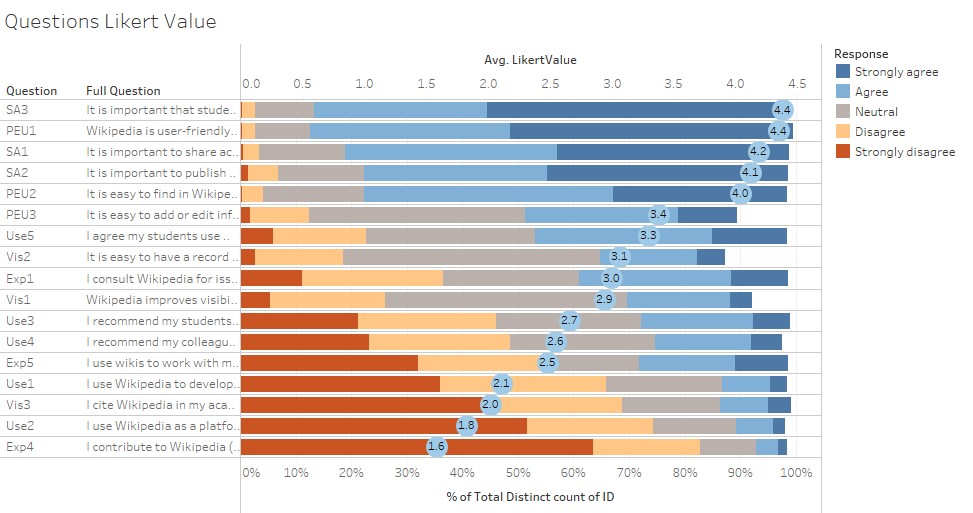
Dashboard 2[https://public.tableau.com/profile/frandy.eddy#!/vizhome/QuestionsLikertValueDashboard/Dashboard3] | Dashboard 2[https://public.tableau.com/profile/frandy.eddy#!/vizhome/QuestionsLikertValueDashboard/Dashboard3] | ||
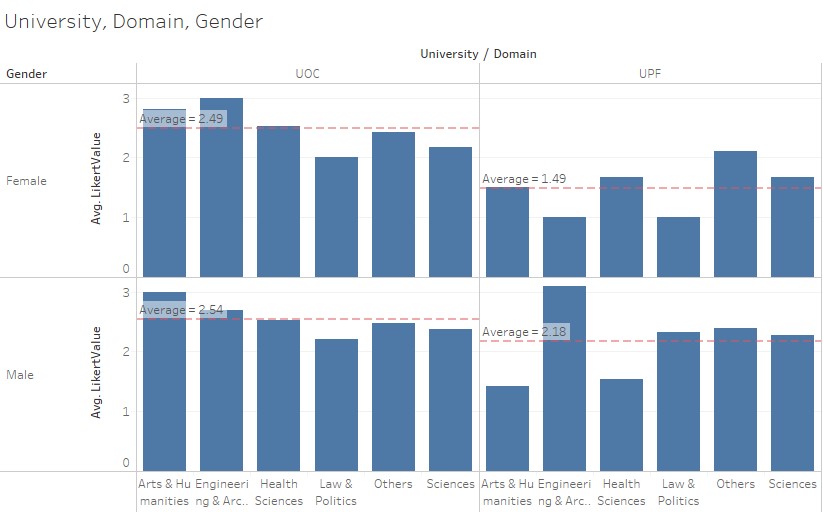
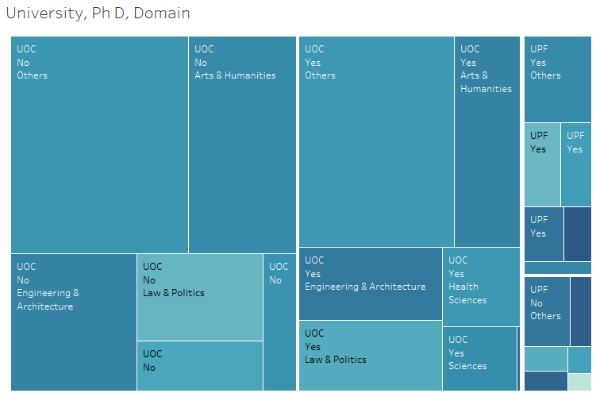
Dashboard 3[https://public.tableau.com/profile/frandy.eddy#!/vizhome/Assignment2_FrandyEddy/Dashboard1] | Dashboard 3[https://public.tableau.com/profile/frandy.eddy#!/vizhome/Assignment2_FrandyEddy/Dashboard1] | ||
| + | |||
| + | = References = | ||
| + | http://www.datarevelations.com/using-tableau-to-visualize-survey-data-part-1.html | ||
| + | <br /> | ||
| + | http://www.datarevelations.com/using-tableau-to-visualize-survey-data-part-2.html | ||
Revision as of 02:53, 26 September 2016
Contents
Abstract
Abstract
Problem and Motivation
Problem:
- What are the
- What are the
Approaches
Step 1: Identify a theme of interest
The data can be obtained from .
Step 2: Define questions for investigation
A
Step 3: Find appropriate data attributes
A
Tools Utilized
Tableau, JMP, Excel
Results
Link to Tableau Public :
Dashboard 1[1]
Dashboard 2[2]
Dashboard 3[3]
References
http://www.datarevelations.com/using-tableau-to-visualize-survey-data-part-1.html
http://www.datarevelations.com/using-tableau-to-visualize-survey-data-part-2.html


