Difference between revisions of "ISSS608 2016-17 T1 Assign1 XU Qiuhui"
Jump to navigation
Jump to search
| Line 17: | Line 17: | ||
===Share of the resale public housing supply in 2015=== | ===Share of the resale public housing supply in 2015=== | ||
| − | |||
| − | |||
| − | |||
| − | |||
| − | |||
| − | |||
| − | |||
| − | |||
| − | |||
| − | |||
| − | |||
| − | |||
| − | |||
| − | |||
| − | |||
| − | |||
| − | |||
| − | |||
| − | |||
| − | |||
| − | |||
| − | |||
===Distribution of the resale public housing prices in 2015 === | ===Distribution of the resale public housing prices in 2015 === | ||
Revision as of 11:37, 29 August 2016
Contents
Abstract
<TBD>
Problem and Motivation
Data
Data Acquisition
Dataset Variables
Data Modelling
Approaches
General Colour Scheme for Charts
Data Analysis
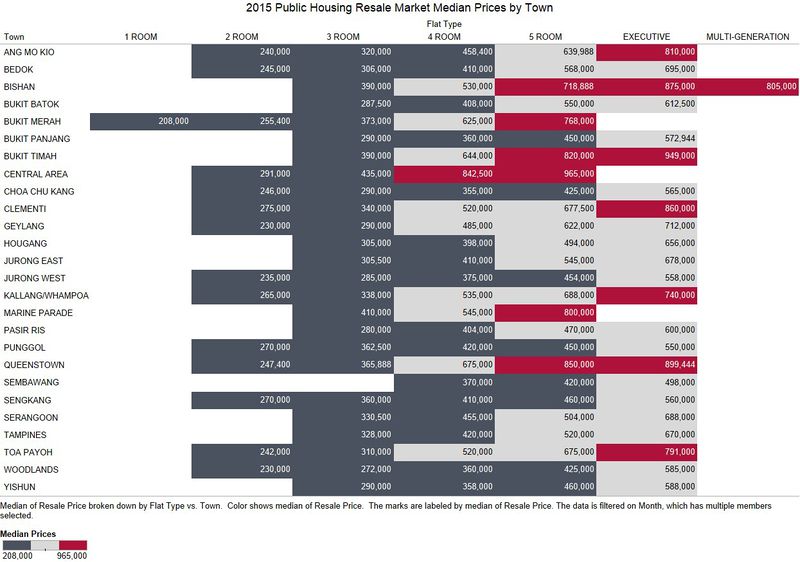
Distribution of the resale public housing prices in 2015
No surprises here. Median prices are higher in mature estates and areas near the city centre such as Central area, Queenstown.
Visualisation rationale: Median avoids outliers. <TBD>
Since primary flats sold are 4 Room, let's focus on 4 Room. Focus on families on a budget.
Visualisation rationale: <TBD>
No surprises on the estates.
Visualisation rationale: <TBD>
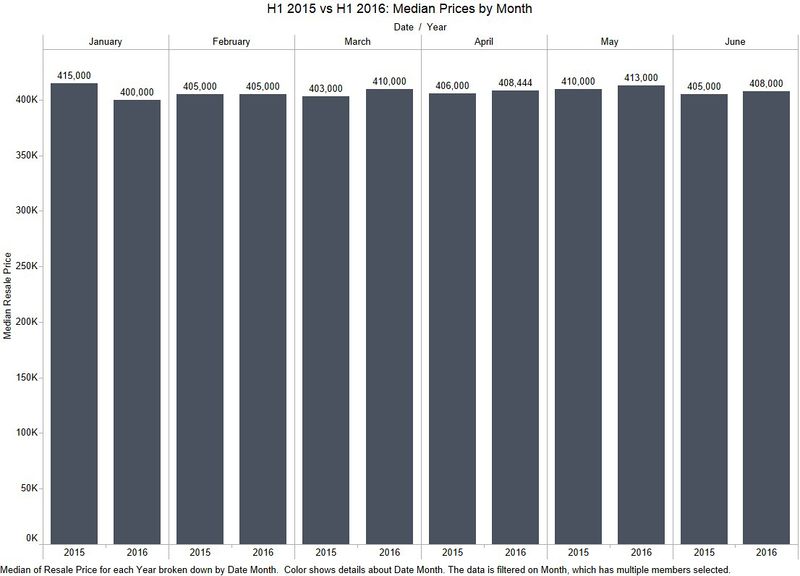
Comparison of patterns of the first-half of 2016 with the patterns of 2015
Visualisation rationale: <TBD>
Visualisation rationale: <TBD>
Visualisation rationale: <TBD>
Infographics
Tools Utilised
- SAS JMP 12 – for initial data exploration and analysis
- Tableau 10.0 – for charting
- Microsoft Powerpoint – for Infographics layout
Results


