ISSS608 2016-17 T1 Assign1 XU Qiuhui
Contents
Abstract
This report focuses on analysis of resale public housing market, 5 factors, flat type, flat size, flat age, flat location, resale price per sqm, are considered. Mainly performs analysis of shares of resale housing supply in 2015, drilling down analysis of pricing of resale public house and comparison of patterns discovered between 2015 and 2016 in first two quarters.
Problem and Motivation
Huge influence and fast changing make resale public housing market one of the most concerned market by Singapore residents. This report is aimed to provide visualized analysis to
- help buyers get good knowledge of resale public housing market price distribution break down by flat type, location, flat age, etc. to choose the most suitable house according to their particular conditions;
- let sellers acknowledged with resale public housing market trends of both supply and price, to sell their house in a good time and price;
- help investors find houses with highest investment potential
Data
Data Acquisition
Dataset Resale Transaction by Flat Type (based on registered cases) is downloaded in csv directly from data.gov.sg.
Dataset Variables
Dataset contain following variables:
| Variables | Description |
|---|---|
| Month | It's the date of registration, in the format of 'yyyy-mm'. |
| Town | Shows the location of the flat by town. |
| Flat Type | Includes 7 type of HDB flat |
| Block | Shows the block number of the flat |
| Street Name | Shows the street name that the flat located |
| Story Range | Divide story into 25 ranges, in the format of 'xx To xx" |
| Floor Area sqm | Shows flat area in square meters. |
| Flat Model | Shows the model type of the flat, including 19 types of models. |
| Lease Commencement Date | It is the date that the flat first time push into market. |
| Resale Price | It is the total price of the flat. |
Data Preparation
Convert Data Type:
- Convert Month from String to Date format: Dateparse('yyyy-MM',[Month])
- Convert Lease Commencement Date from Numeric to Date: The Lease Commencement Date was actually in YYYY format. A similar conversion was done using DATEADD('year',INT([Lease Commence Date])-1900,#1/1/1900#).
Calculations:
- Calculating flat age: Given the of dates above, the age of flat is estimated by getting the difference between transaction date and lease commencement date. The formula used was ([Year-Month]-[Lease commencement year])/365. As this estimated age is likely to be overstated, given that lease commencement date was using default 1st Jan of the respective years, this calculated field is rounded down to a whole number using if [Age of flat]=int([Age of flat]) then [Age of flat] elseif [Age of flat]<0 then int([Age of flat]) else int([Age of flat]+1) end.
- Calculating the price per square metre of resale prices: The prices in the resale transactions were expressed in absolute price of the units. For a more uniform comparison, the prices were converted to price per square meter (psm) using [Resale Price]/[Floor Area Sqm]
Approaches
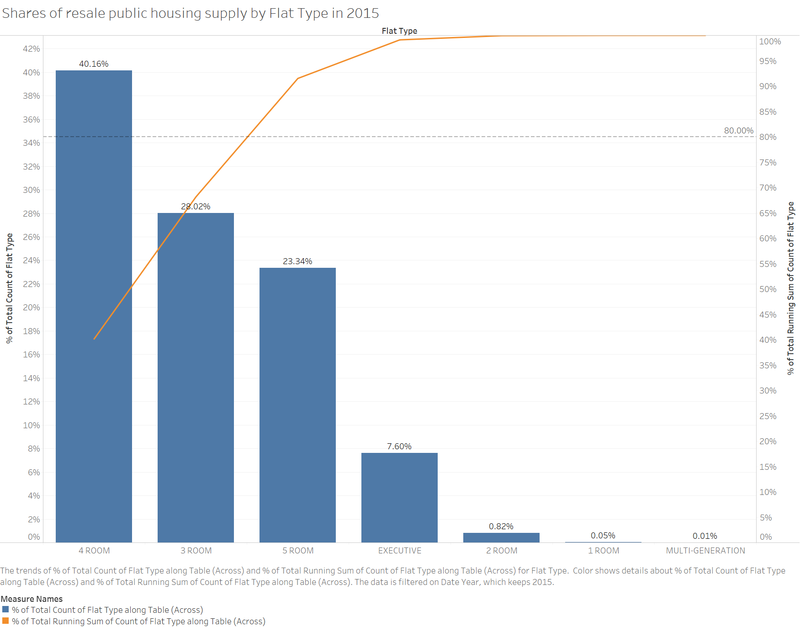
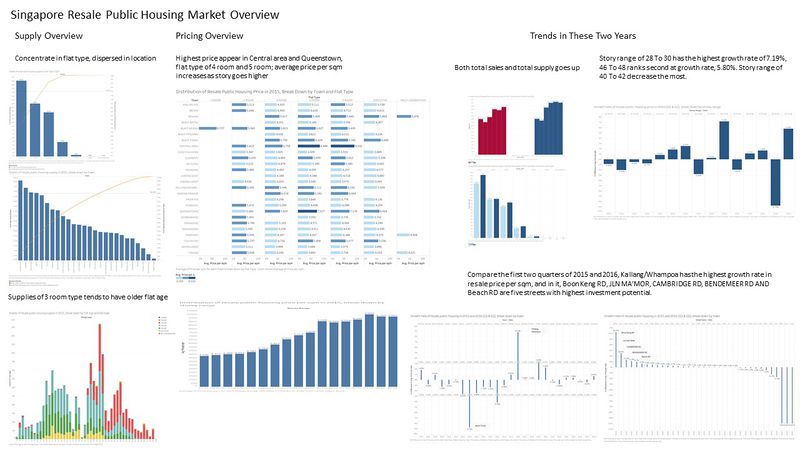
Description: 4 Room and 3 Room are the most popular flat types in resale public market. When we break down resale housing supply by flat type, we can see it's in accordance with two eight theory.
Visualization rationale: Only one variable, flat type, in the chart, so no coloring used.
Description: Supplies of resale public house are higher in remote area rather than central area. And supplies are relatively dispersed, not in consistent with two eight theory.
Visualization rationale: Using Pareto chart to see both distributions and composing conditions. The same as above, since adding color seems no help to reading, so no coloring used.
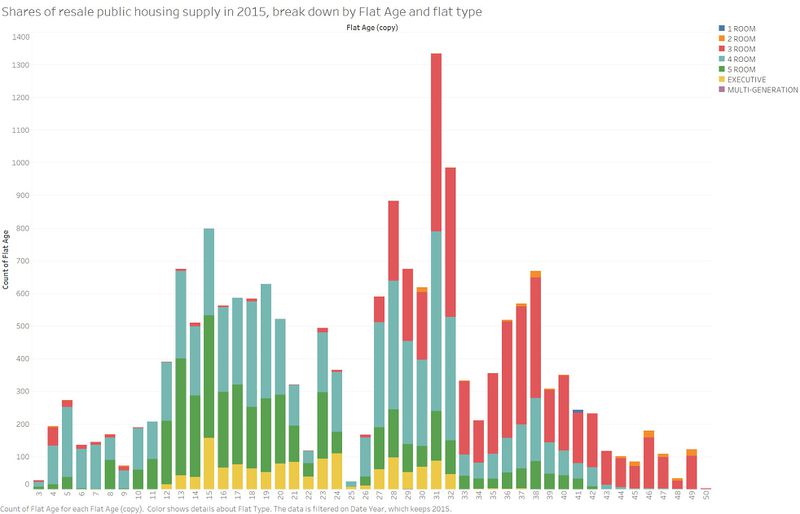
Description: When break down supply by flat age we can see 3 room tends to have older flat age, 4 room's supply have a relatively wide range.
Visualization rationale: Use different color to represent different flat type to help read this chart.
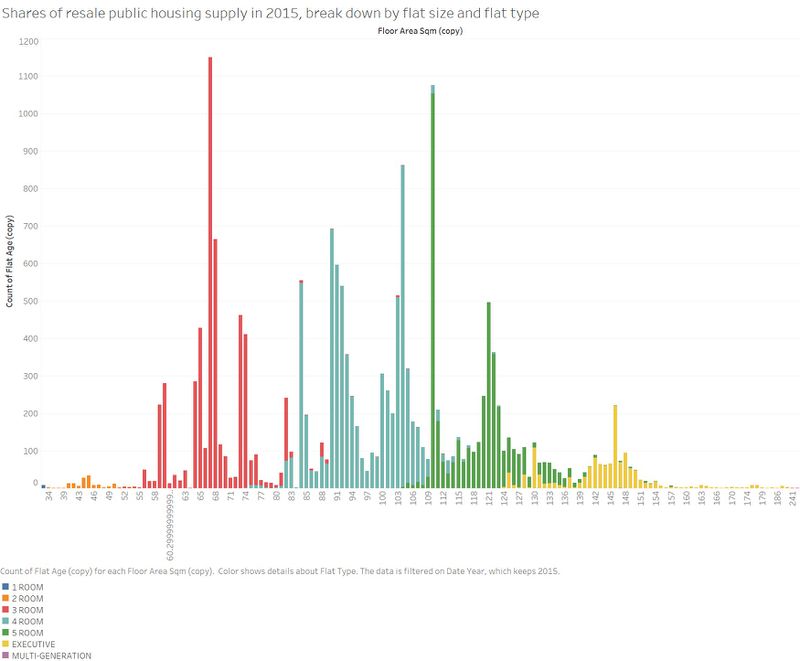
Description: When break down by flat size, we can see for 3 room, it has a concentrated flat size, at around 65sqm; For 4 room, it has a wider and dispersed distribution of flat size.
Visualization rationale: Use different color to represent different flat type to help read this chart.
Distribution of the resale public housing prices in 2015
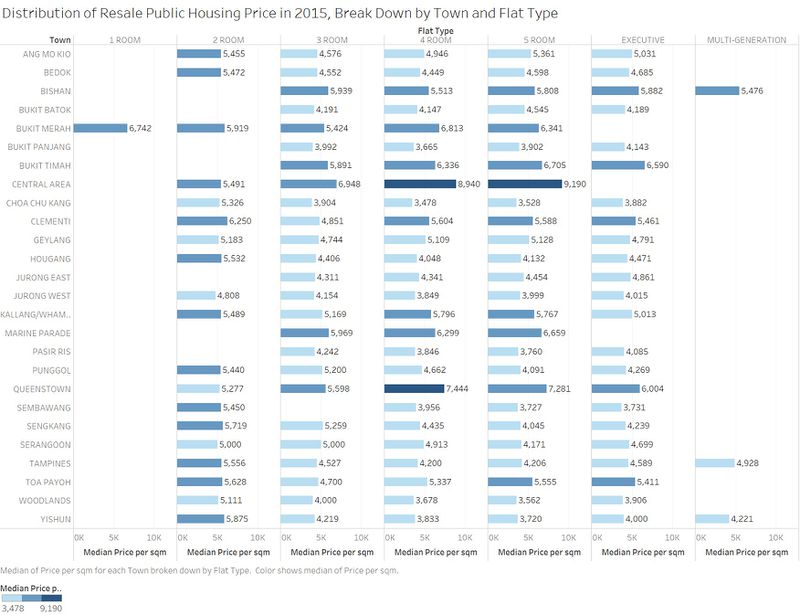
Description: In this graph, we break down average price of resale public house by town and flat type. We can see that the highest average price appear in 4 room and 5 room type in central area and 4 room type in queenstown; by flat type average price tends to decrease as room number in the flat increase; average price tends to decrease as the their distance from central area increase.
Visualization rationale: Use coloring to differentiate average price form low to high, to help read the graph.
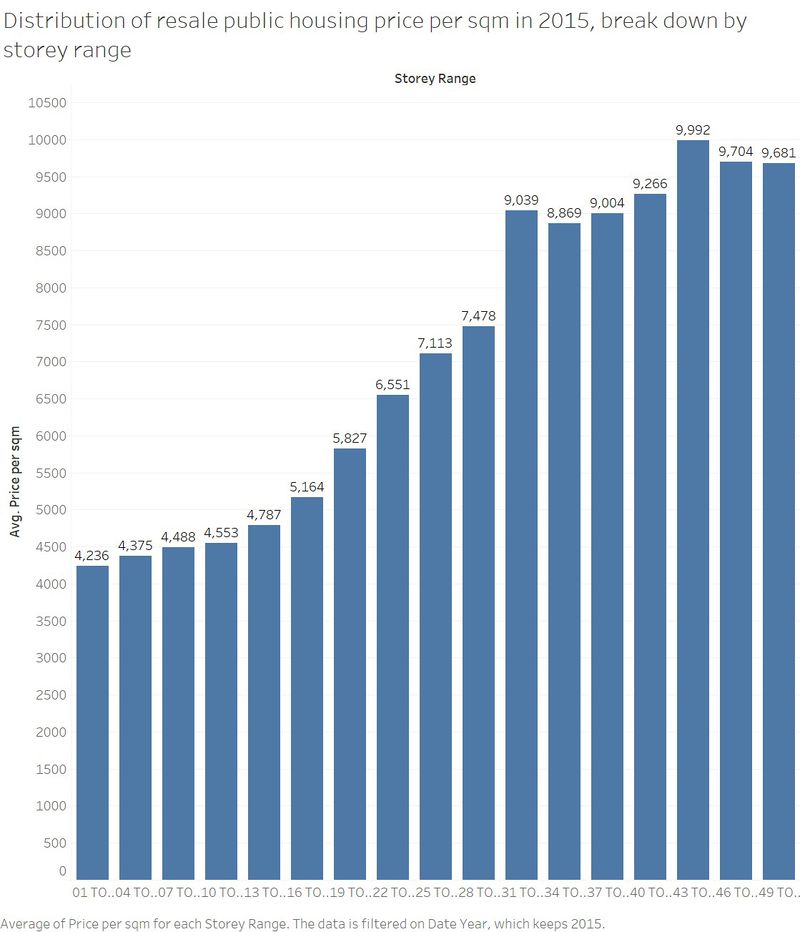
Description: In general, average price per sqm increase as story goes higher. We can see there are a three stairs in the graph, two boundaries are 31 To 33 and 43 To 45.
Visualization rationale: No coloring needed.
Comparison of patterns of the first-half of 2016 with the patterns of 2015
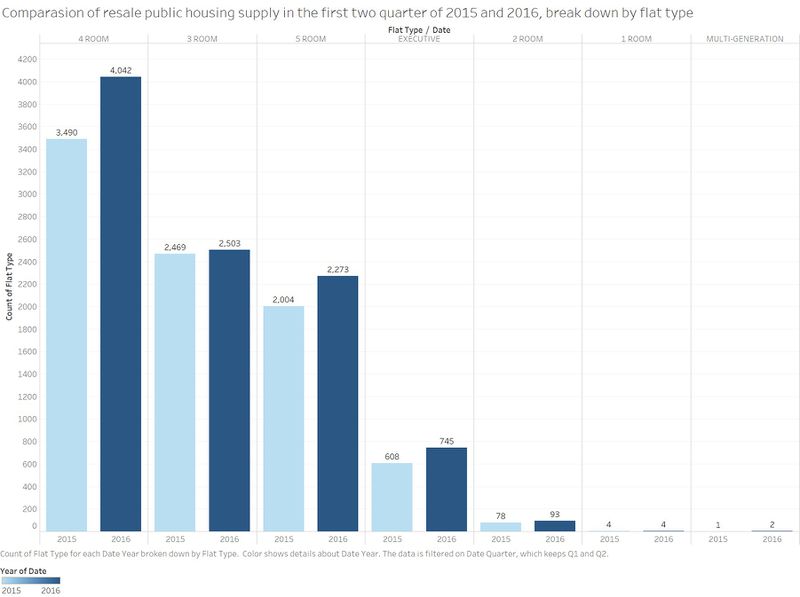
Description: We compare resale public housing supply by flat type in the first two quarters of 2015 and 2016. By each flat type, supply increases.
Visualization rationale: Use coloring to differentiate year.
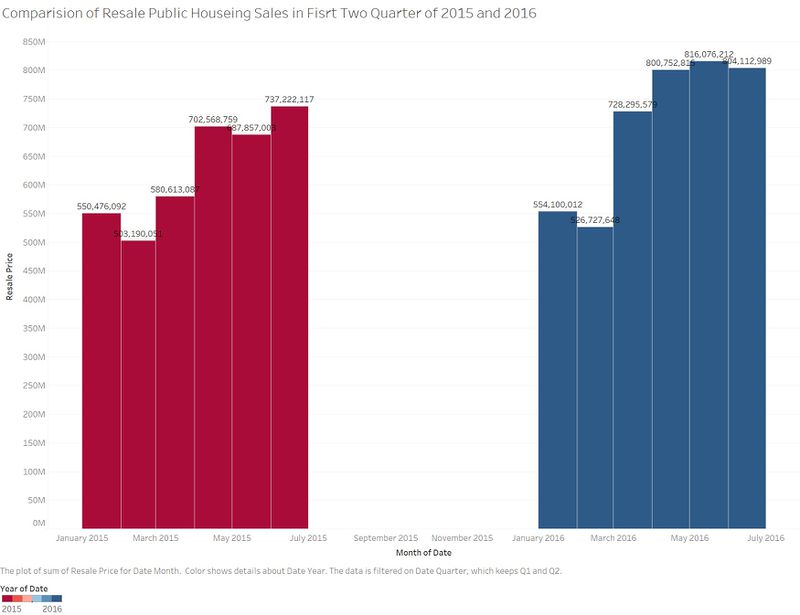
Description: We compare monthly total sales in the first two quarter of 2015 and 2016, we can see the trend keeps the same, while the amount of sales increase in every month in 2016.
Visualization rationale: Use coloring to differentiate year.
Description: Break down growth rate of average price per sqm by town, we can find Kallang/Whampoa has the highest growth rate, 8.73%. Bukit Timah decreases the most, at -8.78%.
Visualization rationale: No coloring needed. Just use annotation to mark the point to help see the town name.
Description: In story range perspective, story range of 28 To 30 has the highest growth rate of 7.19%, 46 To 48 ranks second at growth rate, 5.80%. Story range of 40 To 42 decrease the most.
Visualization rationale: Use bar chart to differentiate increase and decrease, it's very easy to identify.
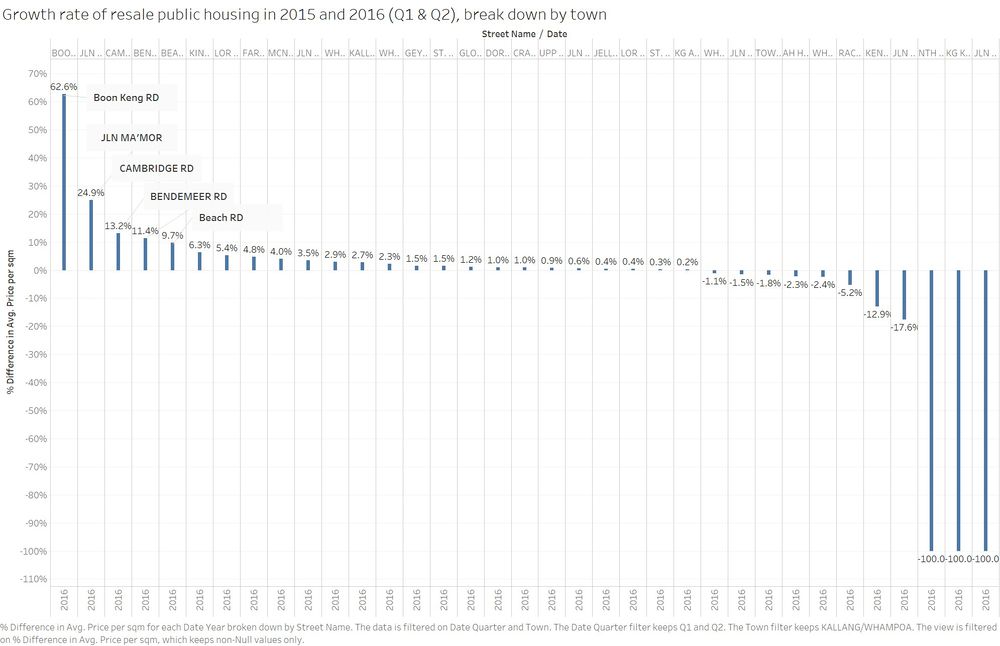
Description: We pick the town, Kallang/Whampoa, with the highest growth rate in resale price per sqm to drill down to street, to find out five street with highest growth rate, in other words, with highest investment potential.
Visualization rationale: Use annotation to mark street name.
Infographics
Tools Utilised
- SAS JMP 12 – for initial data exploration and analysis
- Tableau 10.0 – Visual Analytics
- Microsoft Powerpoint – for Infographics layout
Key Findings
- Compare the first two quarters of 2015 and 2016, Kallang/Whampoa has the highest growth rate in resale price per sqm, and in it, Boon Keng RD, JLN MA’MOR, CAMBRIDGE RD, BENDEMEER RD AND Beach RD are five streets with highest investment potential.
- In total sales of resale public house, 2016 tends to be higher than 2015 in the first two quarters.
- In total supply of resale public house, 2016 tends to be higher than 2015 in the first two quarters.
- Resale price per sqm tends to increase as story range goes higher. Then after comparing first two quarters of 2015 and 2016, we find story range of 28 To 30 has the highest growth rate of 7.19%, 46 To 48 ranks second at growth rate, 5.80%. Story range of 40 To 42 decrease the most.
- We can see that the highest average price appear in 4 room and 5 room type in central area and 4 room type in queenstown; by flat type average price tends to decrease as room number in the flat increase; average price tends to decrease as the their distance from central area increase.
- 4 Room and 3 Room are the most popular flat types in resale public market. When we break down resale housing supply by flat type, we can see it's in accordance with two eight theory.
